Canadian Structured Products Issuance Reaches CAD 9,563.0Mn (+9.6% YoY) as Notes Growth Outpaces a Contracting GIC Market
Key Highlights
- Wrapper Mix: Notes issuance of CAD 6,116.4Mn in August was up 32.5% YoY while market-linked GICs fell 16.1% to CAD 3,446.7Mn, leaving notes at 74.4% of YTD issuance against 25.6% for GICs and confirming a decisive shift away from principal protected formats.
- Structure Mix: Principal At Risk Notes dominate at CAD 40,941.9Mn, or 63.4% of YTD volume, ahead of GICs at 25.6% and Principal Protected Notes at CAD 7,089.5Mn (11.0%), reflecting growing tolerance for capital at risk.
- Product Mix: Income structures lead at CAD 27,360.1Mn (42.4%), ahead of Capital protected at CAD 23,630.0Mn (36.6%) and Growth at CAD 13,553.4Mn (21.0%), the ordering following directly from the contraction in GIC volume.
- Underlying Trends: Single-underlying products make up CAD 51,764.1Mn, or 80.2% of YTD volume, with baskets at 19.4% and worst-of exposure negligible at 0.3%, a construction profile that continues to distinguish Canada from other markets.
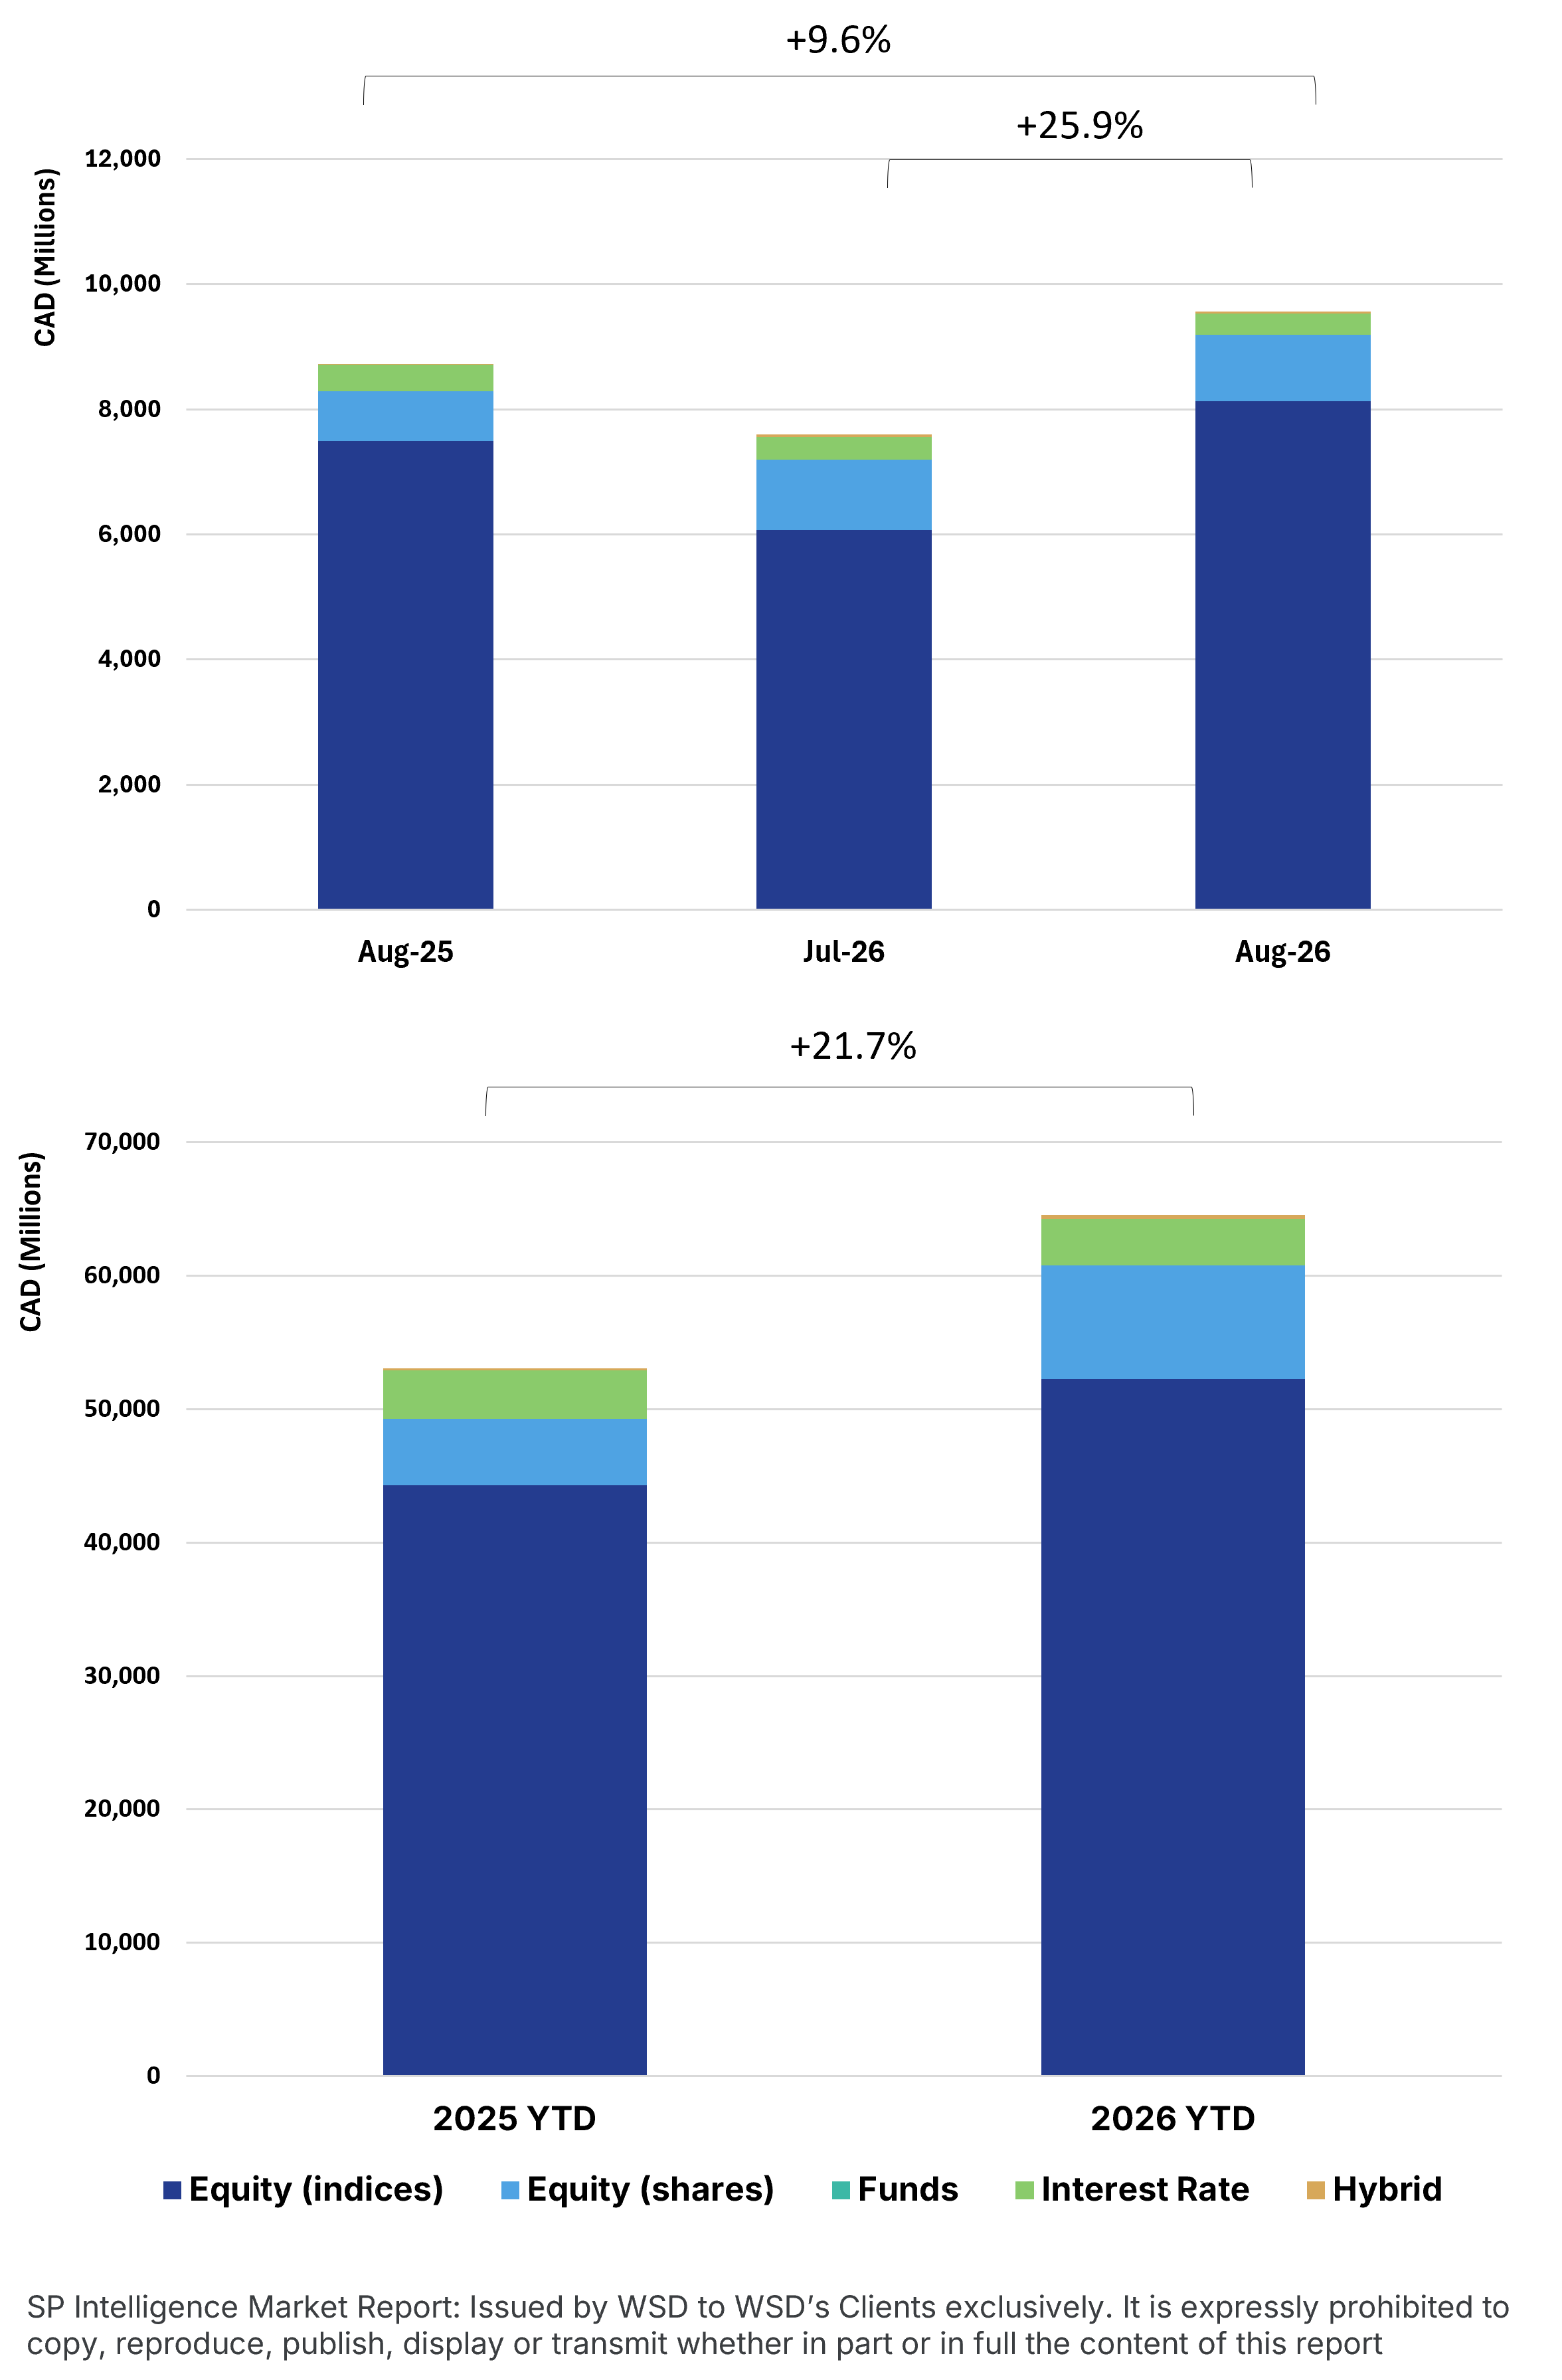
- Asset Allocation: Equity (indices) accounts for CAD 52,247.5Mn, or 80.9% of YTD volume, with Equity (shares) at 13.2% and interest rate exposure at 5.4%, underlining an almost entirely equity-linked market.
Market Overview
August 2026 reflects a rebalancing in the Canadian market, with headline growth concealing a widening split by wrapper. Issuance reached CAD 9,563.0Mn, up 9.6% YoY, taking YTD volume to CAD 64,543.5Mn, up 21.7%. Notes grew 49.4% YTD to CAD 48,031.5Mn while GIC volume contracted 20.9% to CAD 16,512.0Mn, leaving notes at 74.4% of issuance and Principal At Risk Notes alone at 63.4%, ahead of Principal Protected Notes at 11.0%. That mix drives the product ordering, with Income leading at CAD 27,360.1Mn (42.4%), ahead of Capital protected at CAD 23,630.0Mn (36.6%) and Growth at CAD 13,553.4Mn (21.0%). Payoff construction remains concentrated, with barrier phoenix structures at CAD 26,070.9Mn, or 41.0% of allocable YTD volume, followed by capped protected participation at 19.5% and barrier digital plus at 18.7%. Single-underlying products account for 80.2% of YTD volume against 19.4% for baskets, with worst-of exposure negligible at 0.3%. The asset class breakdown is almost entirely equity, with Equity (indices) at 80.9% and Equity (shares) at 13.2%, ahead of interest rates at 5.4%. Roll over speed reached 3.7% in August, the highest monthly reading of the past twelve months against a YTD average of 2.9%. Overall, August reflects a market rotating towards risk, combining solid issuance growth, a decisive move from GICs to notes, and continued dominance of single-underlying, equity-linked structures.
Methodology & Notes
This report is based on SPi's proprietary database of structured products distributed in Canada. Figures reflect best-effort estimates based on available market data at the time of publication.
Disclaimers
Data Disclaimer (Best Effort / Completeness)
The information presented in this report is based on data collected from a variety of public and proprietary sources. While reasonable care has been taken to ensure accuracy, the data may be incomplete, subject to revisions, or may not capture the entirety of the market. SPi makes no representation or warranty, express or implied, as to the accuracy, completeness, or timeliness of the information.
General Disclaimer
This document is provided for informational purposes only and does not constitute investment advice, an offer, or a recommendation to buy or sell any financial instrument or to adopt any investment strategy. The views expressed are those of SPi at the date of publication and are subject to change without notice. Past performance is not indicative of future results.
SPi accepts no liability for any loss arising from the use of this report or its contents.