
Growth of the French Structured Products Market
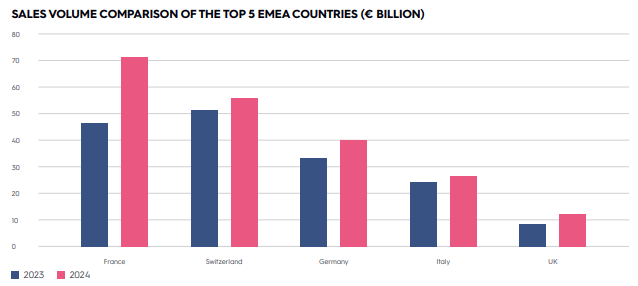
The French structured products market has witnessed remarkable expansion, surging by an estimated +53.4% year-over-year in trading volume. France now represents one-third of the EMEA structured products market, a testament to increasing investor interest in lower-risk interest rate products such as callables and floaters. These instruments, gaining significant traction since 2023, have diversified the market and reduced reliance on decrement indices as the primary structured product component.
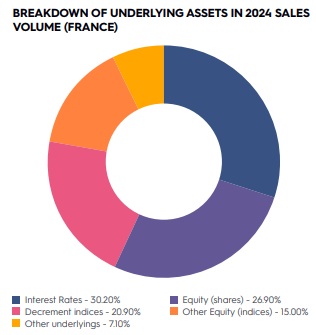
Despite this shift, decrement indices continue to play a crucial role in structured product design, accounting for €14.9 billion in total volume in 2024 and representing 20.9% of all structured product issuance in France. As of March 2025, live products linked to decrement indices have reached €25.2 billion. However, this expansion has not come without risks. While decrement indices have contributed to market growth, they have also raised concerns about performance erosion, investor fairness, and increasing regulatory scrutiny. These issues are shaping the evolving landscape of structured products in France.
Sales Volume Comparison of the Top 5 EMEA Countries (€ Billion)
Breakdown of underlying assets in 2024 sales volume (France)
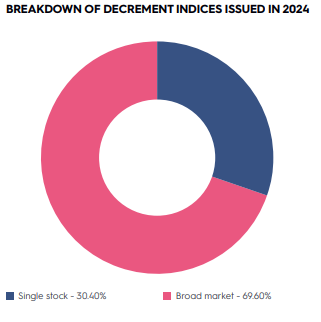
Breakdown of Decrement indices issued in 2024
Decrement Indices: Understanding the Mechanism
Decrement indices are synthetic indices based on a reference index (either broad market or single stock), from which a fixed amount is periodically deducted to represent expected dividends. This decrement is applied either as a percentage (typically 5% per year) or as a fixed number of index points.
The primary objective of decrement indices is to offer predictability in performance by "fixing" the dividend in advance, allowing for higher coupon payments while mitigating dividend risk for issuers. These indices have grown in prominence in structured product design since the mid-2010s. However, concerns arise when fixed decrements in points disproportionately impact performance, especially in the case of single stock decrement indices.
The Strengths of Broad Market Decrement Indices
While single stock decrement indices introduce significant risks, decrement indices linked to broad market indices offer several advantages:
• Diversification Benefits: The fixed decrement is spread across a large basket of stocks, minimizing the impact of individual stock volatility.
• Lower Performance Erosion: Broad market indices tend to experience long-term growth, which can offset the decrement deduction.
• Greater Stability: Unlike single stocks, broad indices benefit from sector rotation and economic expansion, helping to sustain returns even in fluctuating markets.
• Enhanced Coupon Potential: By providing a predictable framework for dividend deductions, broad market decrement indices enable structured products to offer more attractive coupon payments while ensuring stability.
In bullish markets, broad decrement indices often generate returns that comfortably exceed the fixed decrement, making the deduction less detrimental. Their more stable and predictable dividend distributions also align better with decrement structures, reducing risks for investors compared to single stock decrements.
Understanding the Dynamics of Single Stock Decrement Indices and Point-Based Decrements
Decrement indices have become increasingly popular in structured products, particularly in Europe. These synthetic indices are based on a reference index, either broad market or a single stock, with a fixed amount periodically deducted to represent expected dividends. This decrement can either be expressed as a percentage (typically 5% annually) or as a fixed number of index points.
The purpose of using decrement indices is to provide predictability in index performance by "fixing" the dividend in advance, which allows for higher coupon payments for investors while mitigating dividend risk for issuers. Since their introduction in the mid-2010s, decrement indices have played an important role in structured product design.
There is a distinction between percentage-based and point-based decrements. In a percentage decrement, the index is reduced proportionally to its level (e.g., -5% per year), while in a point-based decrement, a fixed nominal amount is subtracted regardless of the index level.
• In a bearish or stagnant market, an index with a point-based decrement may experience a faster erosion of value compared to an index with a percentage-based decrement, because the point deduction represents a larger share of the index's value as the index declines.
• In a bullish market, the point-based decrement may have a lesser proportional impact on the index's rise compared to a percentage-based decrement, as the nominal deduction remains constant despite the increasing value of the index.
This asymmetry in the effects of point-based decrements on the index's performance is recognized in industry reports, noting that such mechanisms can complicate the index’s ability to recover in certain market conditions.
As summarized in a 2023 report from the Autorité des marchés financiers (AMF): "A decrement in points has asymmetric effects on the rise and fall of the index. It penalizes the holder more in downturns than it benefits them in upturns." In other words, a decrement fixed in points, which was initially equivalent to 5% of the index, becomes much heavier in the event of a prolonged decline, to the detriment of the investor. Additionally, this mechanism decreases probability of the index’s recovering.
The Stellantis Case: A Revealing Example in 2024
In 2024, Stellantis stock – often used as a single-stock underlying in structured products – highlighted these issues. Several structured products launched in 2022–2023 were based on a “Stellantis decrement index.”
For example:
• The Euronext G Stellantis Decrement 1.20 index deducted 1.20 points per year from Stellantis NV stock performance.
• The FTSE Stellantis Decrement 1.34 applied a 1.34€ decrement per year.
However, in 2023–2024, Stellantis’ actual dividend was 0.68€ per share (in 2024), or about 5% yield. The fixed decrements (1.20€ or 1.34€) were therefore twice as high as the actual dividend flow. Combined with Stellantis' stock decline in 2022–2023, this caused a significant underperformance of the synthetic index compared to the actual stock.
From late 2021 to late 2023, the Stellantis Decrement 1.20 Index dropped by about -32%.
Direct Consequences:
• Many structured products tied to these indices failed to reach their early redemption thresholds or coupon payment levels because the index remained far lower than the stock price.
• While Stellantis' stock might have held steady or rebounded modestly (especially when including real dividends), the decremented index stayed persistently behind, preventing any gains.
For instance, an autocall product launched in early 2022 with a 100% recall barrier had no chance of early redemption if its underlying index included an oversized decrement – dragging its performance permanently into negative territory.
At final maturity, the investor even risks capital loss if the index fails to recover above the protection barrier (often set at 50% of the initial level).
This is why some experts argue that the conditional "capital protection" advertised in these products is partly illusory.
The use of decrement indices – particularly point-based decrements – sparked strong criticism in 2023–2024 from various financial professionals in France.
Several wealth management firms and independent analysts have sounded the alarm on the structural disadvantages of these indices.
For instance, Auguste Patrimoine, an advisory firm, strongly discourages the use of decrement indices in structured products due to hidden costs and increased risk of underperformance for retail investors.
Additionally, conflicts of interest have been raised. Banks have a vested interest in using proprietary decrement indices because:
1. They eliminate dividend risk for the issuer.
2. They reduce the likelihood of paying coupons or early redemption (by dragging down index performance).
When applied to broad market indices, the fixed deduction is spread across a diversified basket of stocks. This diversification helps to reduce the impact of volatility from individual stocks, leading to potentially more stable performance in comparison to single-stock decrement indices. Broad indices may experience less severe underperformance relative to standard benchmarks due to this reduced volatility. Moreover, broad market indices tend to benefit from long-term growth trends and sector rotation, which can offset the impact of the fixed decrement over time.
In contrast, single stock decrement indices do not have the same buffer from individual stock volatility. As a result, a fixed-point deduction can have a more pronounced impact when the stock’s performance is volatile. This can lead to greater variability in performance, especially if the stock experiences a decline that is not offset by other factors.
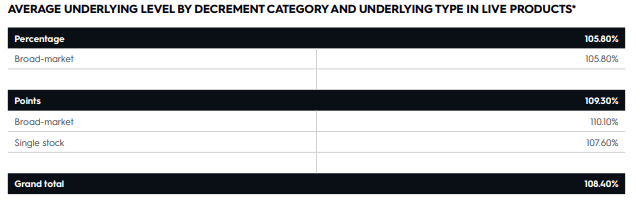
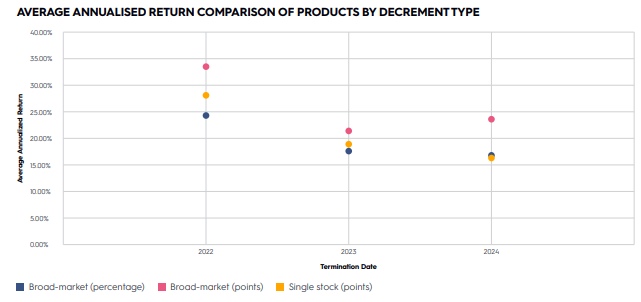
Statistical data shows that, on average, point-based decrement underlyings in live products tend to have slightly higher levels (by 2.6%) compared to their percentage decrement counterparts. However, this difference may not be directly attributed to the decrement type, as other factors could also influence performance. For example, structured products linked to single stock underlyings with point-based decrements have historically outperformed broad-market indices with percentage-based decrements.
Source: SPi, part of WSD
Recently, with more dividend variability, point decrement indices on single stock underlyings suffered, as illustrated by the Stellantis case. In fact, almost one third of the underlyings had a decrement higher to the realized dividend in 2024 – sometimes by a sensible amount. In fact, the average decrement point for single stocks was €2.45 in 2024, while the average dividend in absolute value was €1.95. For the first time, structured products featuring single stocks with point decrements offered annualised returns slightly lower than products featuring broad-market indices with percentage decrement (-0.44ppt).
Comparison of realized dividends vs. average decrement per stock in 2024
Source: SPi, part of WSD
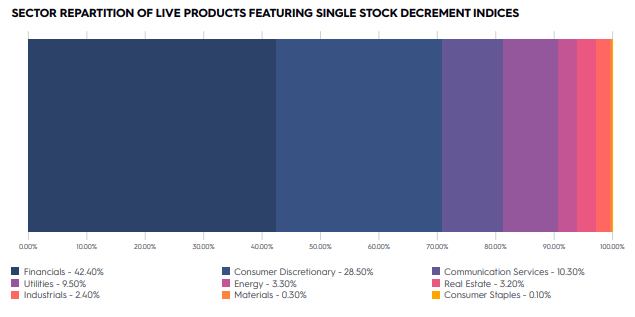
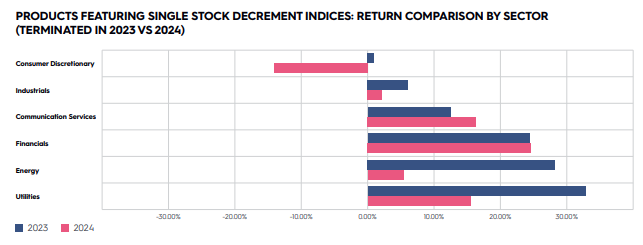
Sector analysis of single stock decrement indices
The sector exposure of French single-stock decrement indices is heavily concentrated in Financials (42.4%) and Consumer Discretionary (28.5%), which together account for over 70% of the total sector allocation. Within Financials, the three major banks — Société Générale, BNP Paribas, and Crédit Agricole — dominate the exposure, reflecting the sector’s strong dividend yields and structural appeal for decrement strategies. Meanwhile, Consumer Discretionary includes mainly automotive manufacturers. Defensive sectors like Communication Services (10.3%) and Utilities (9.5%) offer stability and more predictable dividends, supported by their steady cash flows and reliable payout structures.
Source: SPi, part of WSD
Conclusion
Decrement indices continue to play a significant role in structured products, offering a way to manage dividend expectations while supporting structured returns. Broad market decrement indices provide stability, diversification, and enhanced coupon potential, making them well-suited for a wide range of investment strategies. Their ability to spread the decrement across multiple stocks reduces volatility and aligns well with long-term market growth trends.
Single stock decrement indices, however, require a more nuanced approach. Their performance is more sensitive to stock-specific factors, and their suitability varies depending on investor profile and risk tolerance. These structures may not be appropriate for all clients, particularly retail investors, without a clear Value for Money (VfM) assessment and well-defined target market criteria.
With growing regulatory scrutiny and evolving industry standards, structured product issuers and distributors may benefit from a more tailored approach—ensuring that decrement structures align with investor needs while maintaining transparency, fairness, and sustainability in product design.


