
It is often assumed that manufacturers dictate what products are available in the market. While manufacturers drive innovation and continuously develop new offerings, the ultimate decision rests with investors. Over the long term, actual sales volumes provide a meaningful indicator of U.S. investors’ preferences and demand.
Over the past five years, U.S. investor preferences have shifted toward longer-term investments, consistent coupon rates, and greater exposure to riskier and more globally diversified assets. These trends underscore a willingness to embrace calculated risk in pursuit of higher returns, providing valuable insights for manufacturers and market participants seeking to align products with investor demand.
In response to a shifting macroeconomic backdrop characterised by higher-for-longer interest rates and elevated market uncertainty, investors have adapted their structured product allocations by adjusting multiple design parameters. Rather than relying on a single dimension of diversification, investors have actively calibrated underlying asset selection, investment tenor, capital protection, and structural features such as multi-underlying (worst-of) formats to align risk and return with changing market conditions.
Coupon Stability Persists Despite Elevated Market Volatility
Despite fluctuations in the SPX and broader market volatility, the average coupon rate has remained remarkably stable. In 2022, U.S. interest rates underwent one of the fastest and most aggressive tightening cycles in decades, occurring simultaneously with a sharp spike in equity market volatility. Investor responses diverged meaningfully across risk profiles.
On one hand, the SPX Index emerged as the primary beneficiary of elevated volatility, with issuance rising to USD 33.4Bn, up +131% YoY, accounting for a disproportionate share of total market growth. This behaviour highlights the SPX’s role as the default risk carrier for investors willing to remain exposed to equity markets during periods of stress. By contrast, demand for higher-beta and non-U.S. equity exposure softened materially, with issuance linked to the RTY Index declining by –27% YoY and SX5E Index by –22% YoY, signalling a clear preference to consolidate risk into large-cap, highly liquid U.S. benchmarks rather than small-cap or foreign indices amid heightened uncertainty.
At the same time, more risk-averse investors gravitated toward capital-protected products, where issuance rose sharply to USD 22.3Bn in 2022, reflecting a desire to preserve principal while maintaining conditional upside participation.
Taken together, these parallel trends illustrate how structured products enabled investors to respond selectively to the volatility and tightening shock, adopting tailored solutions aligned with individual risk tolerance rather than pursuing a uniform risk-off strategy.
Average coupon rate per annum vs. SPX volatility
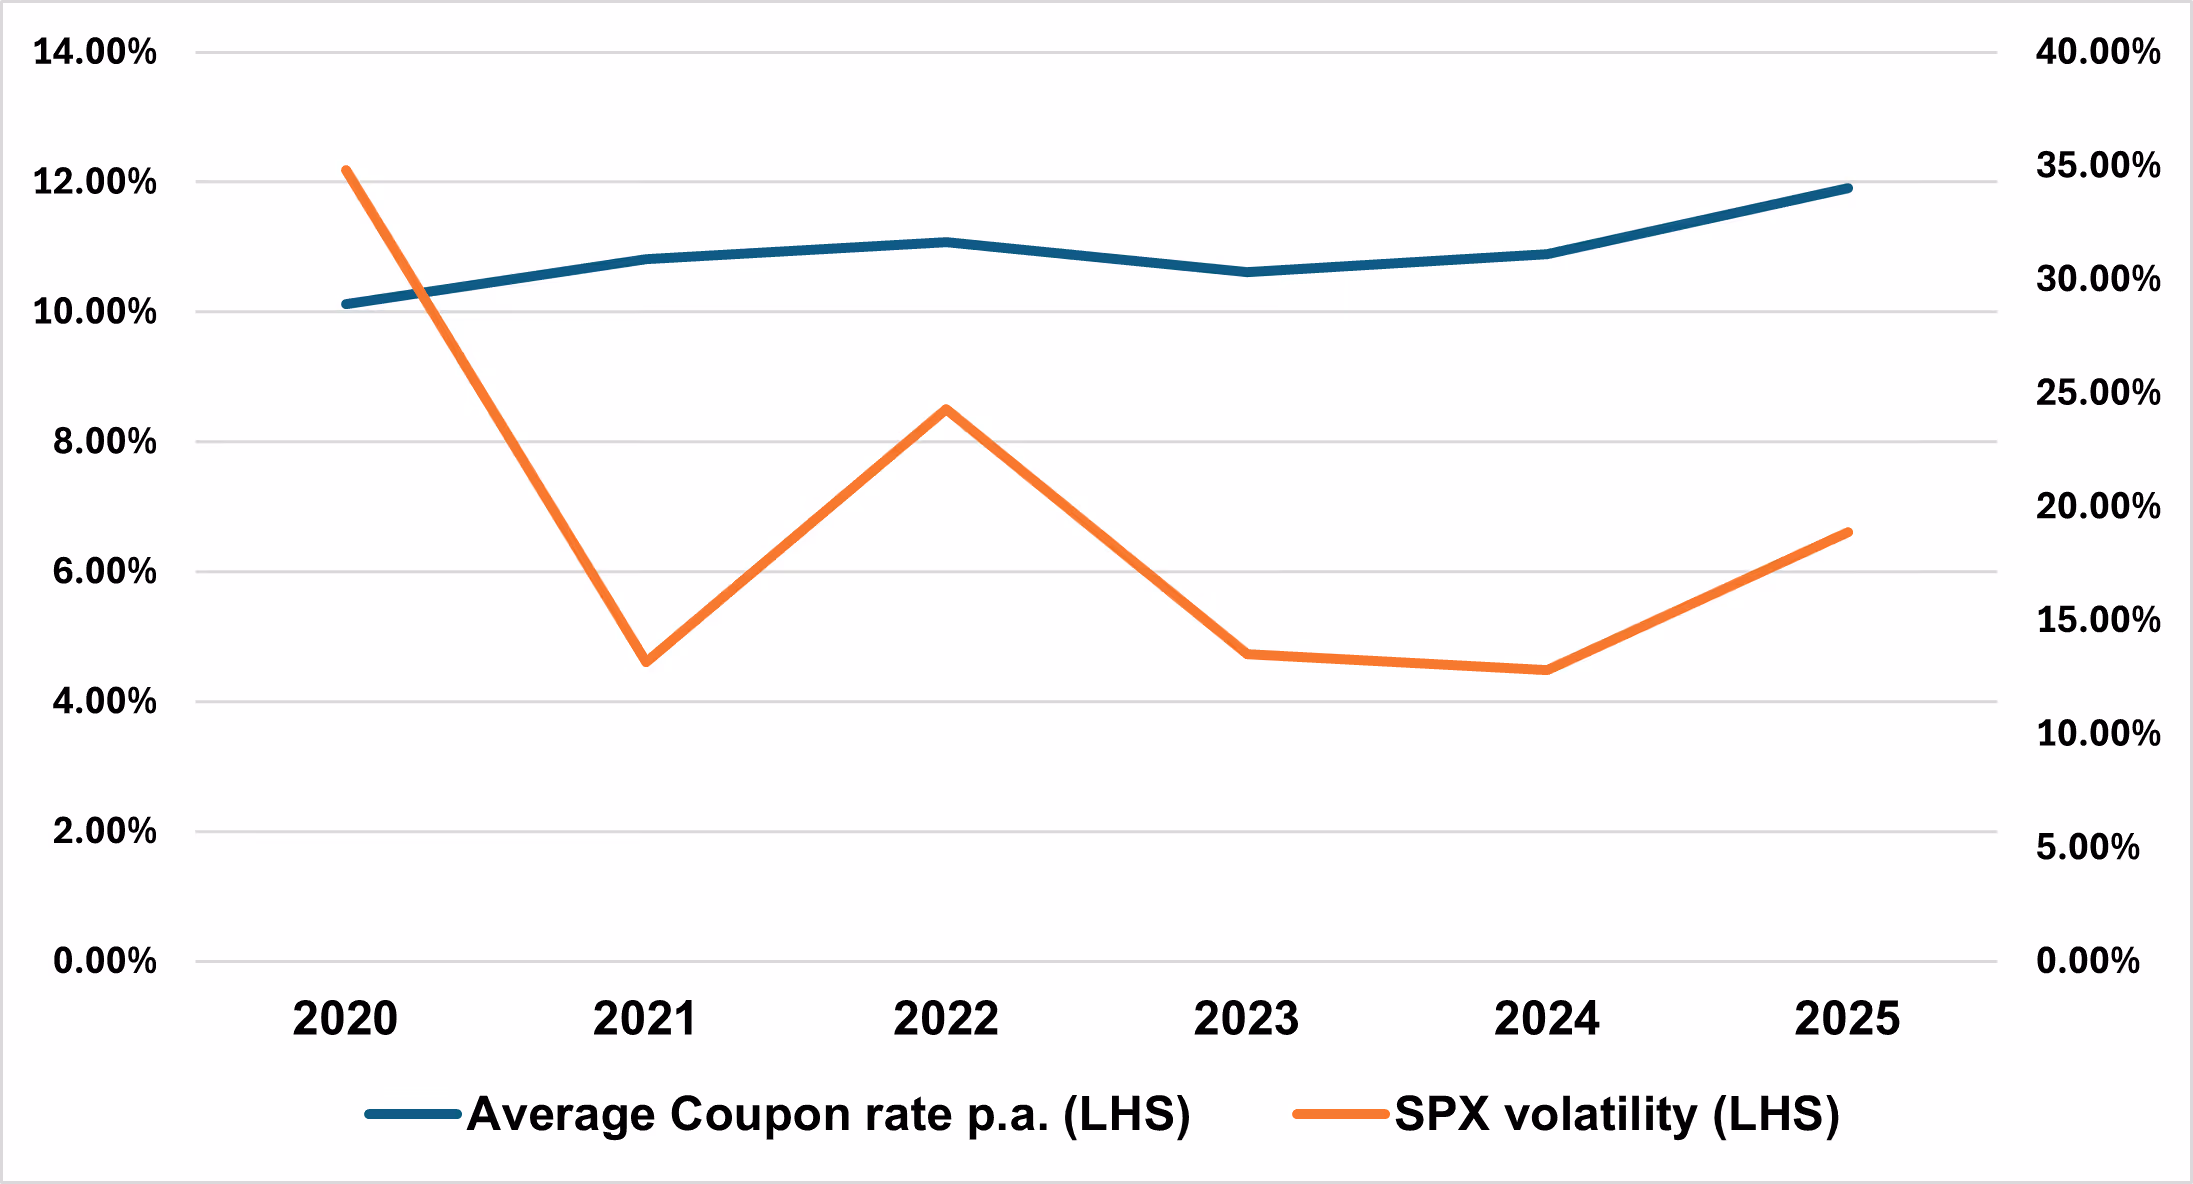
Source: SPI, part of WSD
Extending Investment Horizons Amid a Shifting Rate Environment
Interest rate changes have significantly influenced the popularity of investment products. Short-term offerings have experienced declines in demand during periods of rising rates, while medium-term products (3–4 years) benefited from a favourable interest rate environment. Notably, there has been considerable growth in long-term rate products, reflecting investors’ willingness to commit capital for extended periods in exchange for more predictable returns.
Product types volumes by tenor
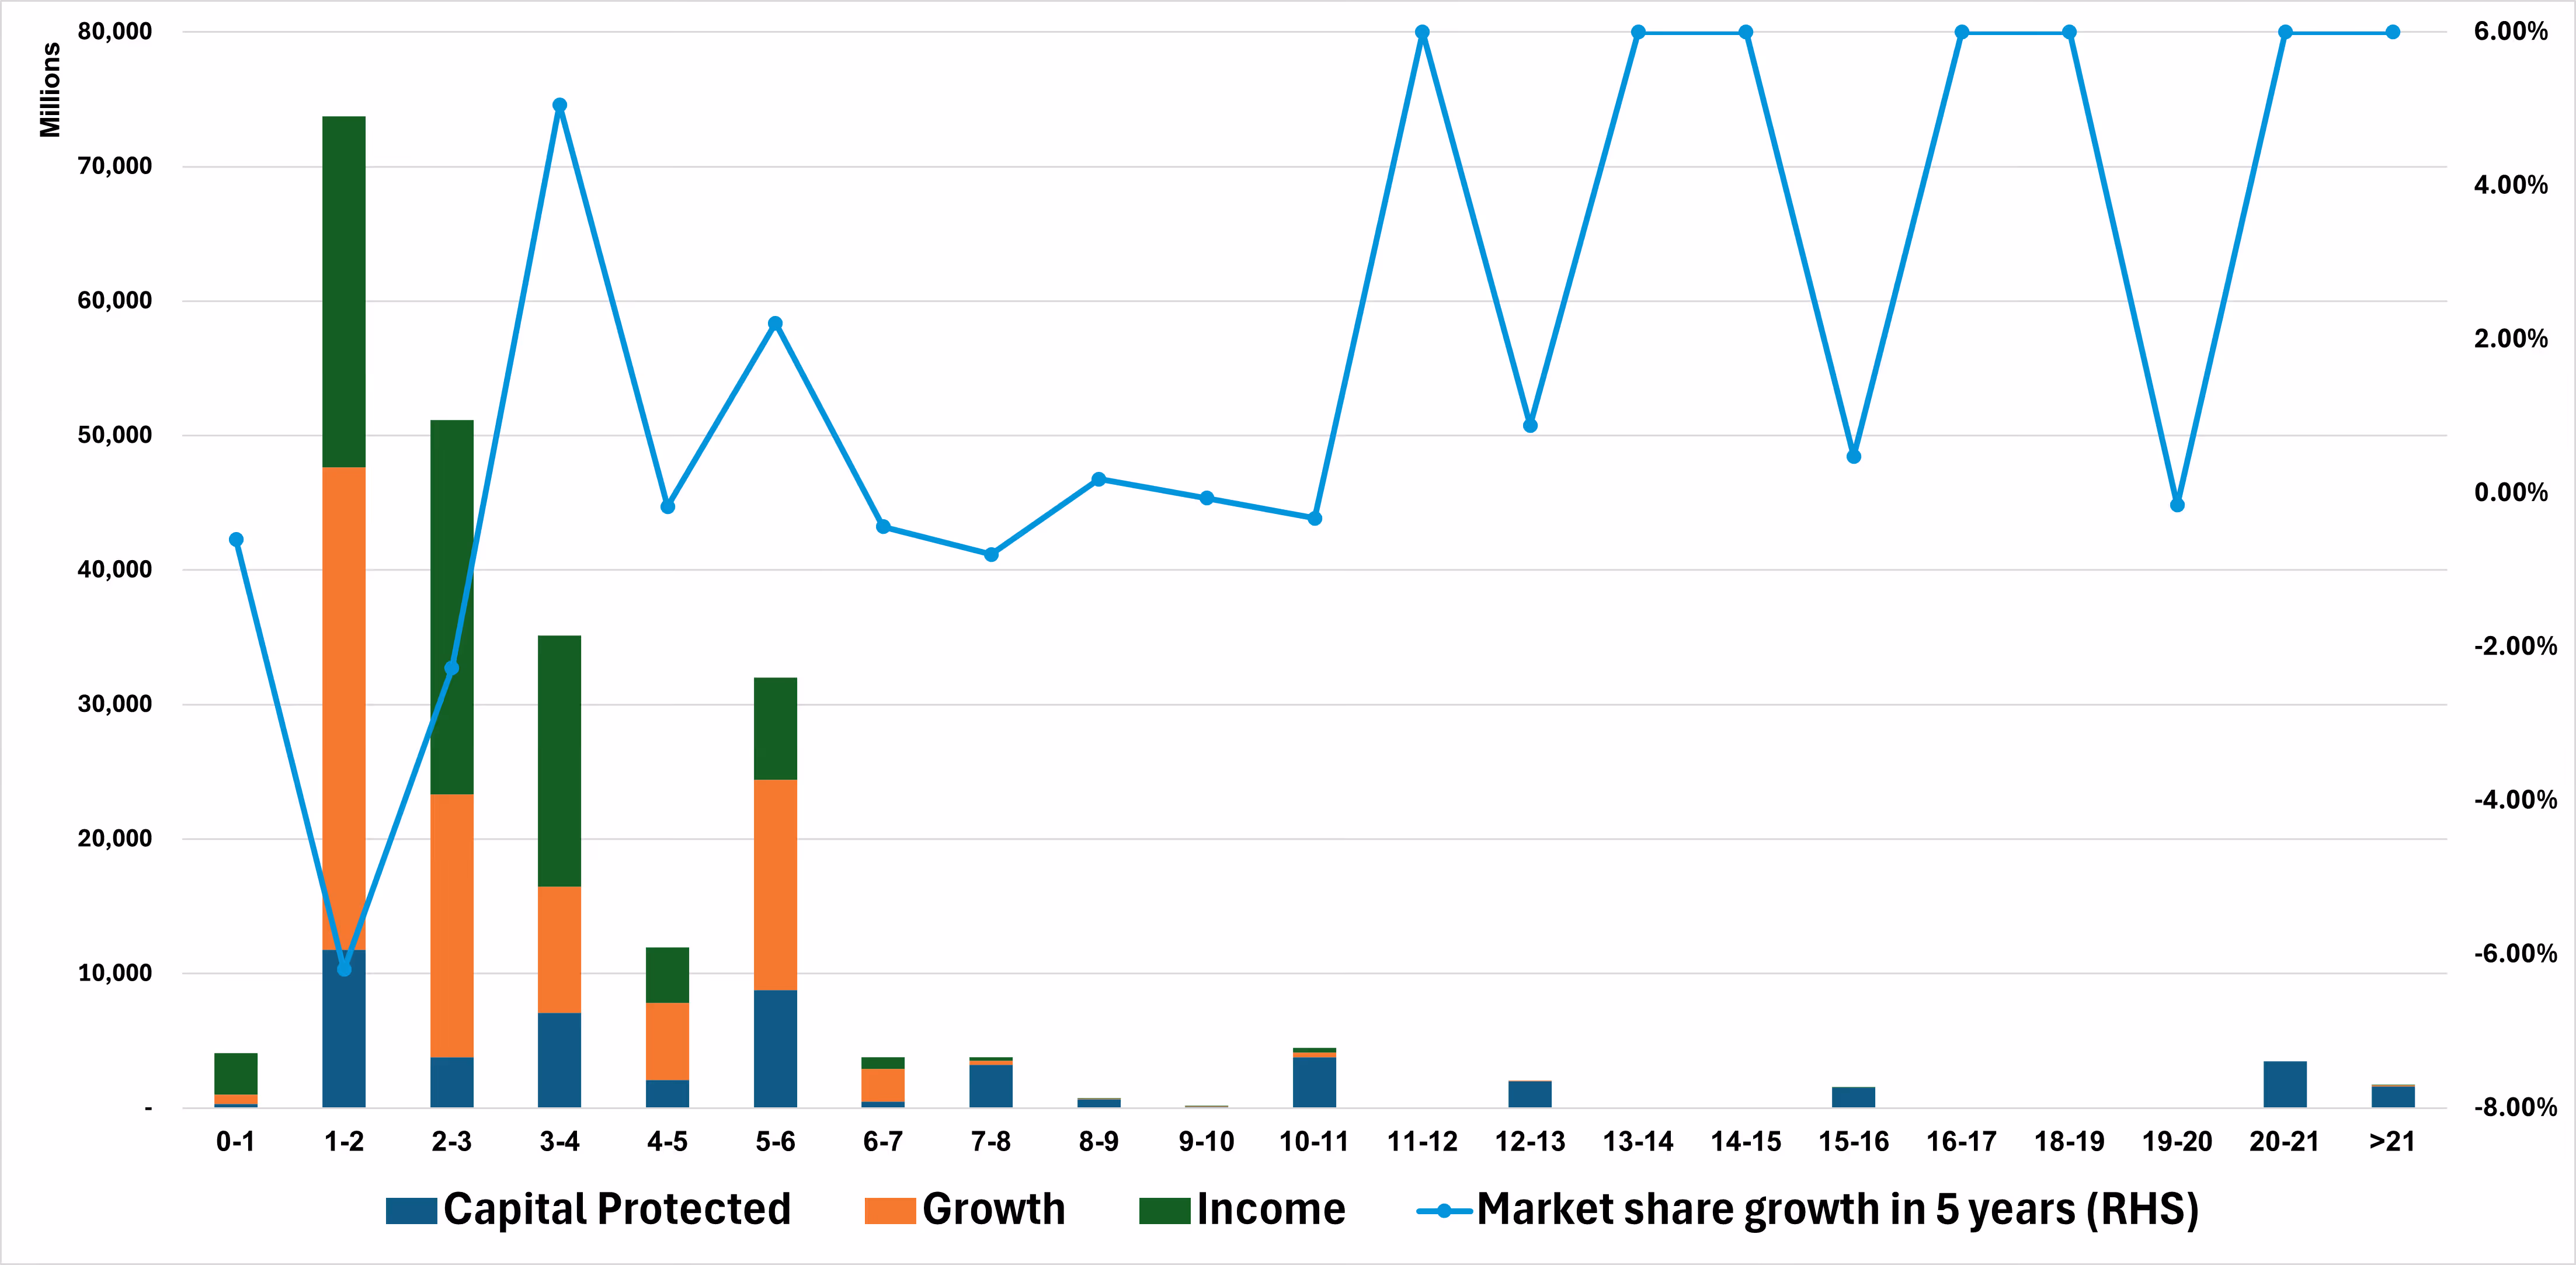
Source: SPI, part of WSD
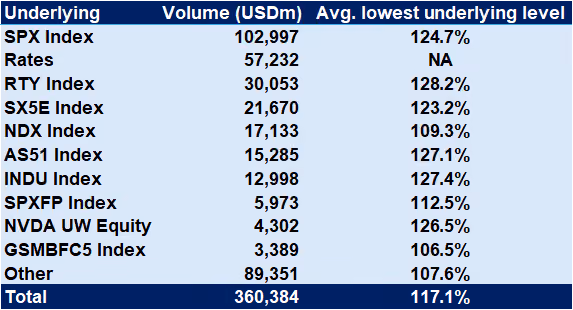
U.S. Exceptionalism at the Core of Underlying Selection
Investor diversification over the past five years has been driven less by geographic rotation and more by structural and payoff design choices. While there has been some incremental increase in exposure to international markets, the U.S. market remains overwhelmingly dominant from a regional perspective.
This concentration is evident in underlying usage: U.S. equity indices account for the majority of structured product volume, with the S&P 500 alone representing approximately USD 103bn, or nearly 29% of total issuance. When combined with other U.S. equity indices in the top 10 underlyings, including the Russell 2000 (USD 30bn), Nasdaq-100 (USD 17bn), Dow Jones Industrial Average (USD 13bn), and SPX Factor indices (USD 6bn), U.S. equity exposure within the top 10 alone exceeds USD 165bn, representing roughly 46% of total issuance volume, excluding single-stock products.
By contrast, non-U.S. equity indices remain comparatively marginal, with the Euro Stoxx 50 accounting for USD 22bn (6%) and Australian equities (AS51) representing USD 15bn (4%), underscoring the limited role of geographic diversification outside the U.S.
Instead of reallocating across regions, investors have primarily expressed diversification through product type selection, rotating between capital-protected, growth, and income structures, and through underlying choice within U.S. equities. This pattern suggests that diversification has been pursued by modifying payoff profiles and risk buffers, rather than by materially reducing reliance on U.S. equity markets.
Top 10 Underlyings by Outstanding Volume and Their Average Performance Since Inception
Market Share by Region and Asset Scope (2020 vs. 2025)

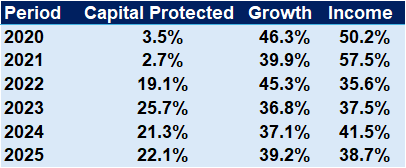
Product-Type Market Share Trends by Year of Issuance
Source: SPI, part of WSD
Recent Trends in Equity-linked products
SX5E Overtakes Russell 2000 Index in mono-underlying deals
From 2020–2023, U.S. sales volumes of single-underlying structured products linked to SX5E and Russell 2000 (RTY) moved largely in parallel, reflecting balanced investor appetite across European large caps and U.S. small caps. 2024 marked a clear inflection in favour of RTY, with volumes accelerating to USD 6.92Bn, materially outpacing SX5E at USD 3.67Bn, as investors leaned into small-cap beta amid expectations of U.S. domestic growth. This dynamic reversed in 2025, as rising risk aversion toward small caps drove a rotation into European large-cap exposure, lifting SX5E issuance to USD 6.15Bn and overtaking RTY at USD 5.51Bn. The shift underscores a late-cycle preference for liquidity, earnings visibility, and dividend support embedded in large-cap Eurozone equities.
Single-Stock Underlying Concentration in the AI Cycle
Single-stock demand in the U.S. structured products market has become increasingly concentrated in a narrow set of large-cap U.S. technology names, with volumes rising sharply in the post-2022 period. NVDA stands out as the dominant underlying, with issuance increasing from USD 142m in 2020 to over USD 5.0Bn in both 2024 and 2025, reflecting strong investor conviction in the AI investment cycle and its associated earnings growth potential. TSLA and AMZN have remained core underlyings throughout the period, with volumes recovering and expanding into 2025, while META and GOOGL also saw renewed traction as investors repositioned around AI-driven monetisation and platform efficiency themes. More recently, PLTR has emerged as a fast-growing underlying, with issuance accelerating sharply into 2025, underscoring growing appetite for higher-beta, AI single-stock exposure when accessed through structured formats.
Most popular equity shares underlying by volume (USDm)
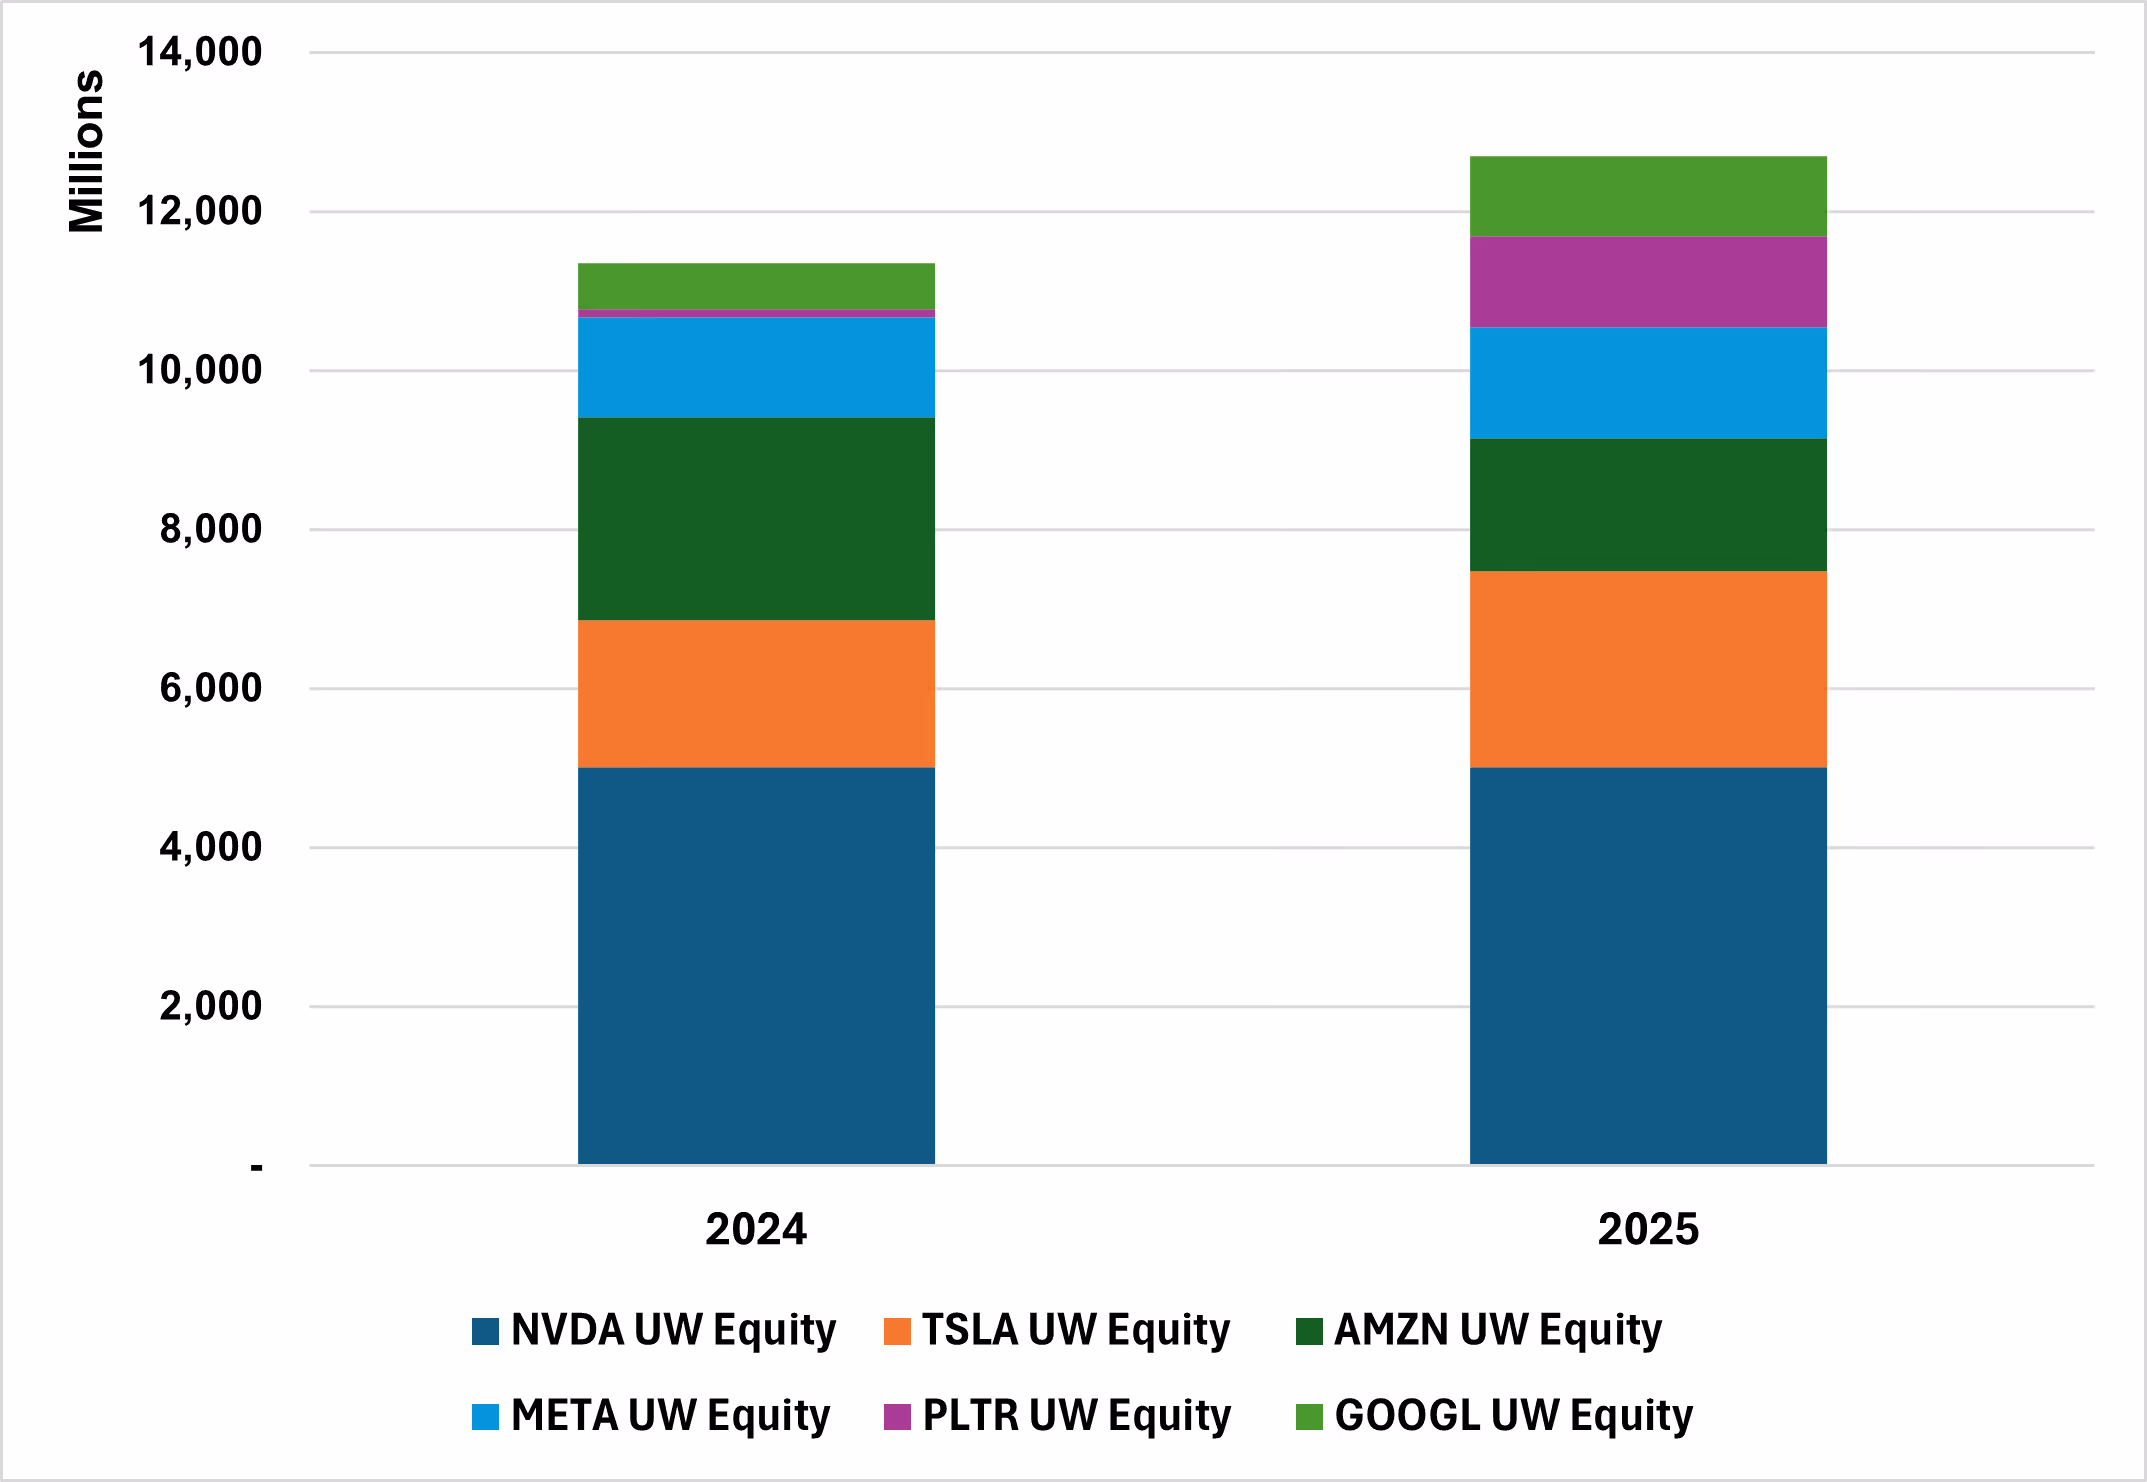
Source: SPI, part of WSD
Emergence of Crypto-Linked Issuance in Structured Products
Crypto-linked issuance, while still modest at USD 0.55bn, gained traction in 2025 as a targeted expression of the debasement and hard-asset hedge narrative, particularly in the context of persistent inflation concerns and fiscal uncertainty. This uptake was enabled by the institutionalisation of Bitcoin through the launch and adoption of spot Bitcoin ETFs, which have materially lowered the operational, tax, and custody barriers historically associated with direct crypto exposure. In particular, IBIT emerged as the preferred reference for structured products, offering investors regulated, liquid access to bitcoin within familiar product wrappers. As a result, Bitcoin has increasingly been positioned as a complementary allocation within broader diversification strategies, rather than a standalone speculative exposure.
Single-Underlying Dominance Eases After 2023 Despite Continued Volume Growth
This year, Worst-of structures continued to regain share, attracting an additional USD 11.1Bn versus 2024 and gaining approximately +1.6pp of market share to 32.8%. This growth reflects renewed investor appetite for correlation exposure and higher coupon potential in a more stable volatility environment.
Basket products also saw incremental gains, with issuance rising by USD 3.1Bn YoY and market share increasing by roughly +1pp to 4.5%, albeit remaining a niche segment relative to Single and Worst-of formats.
Overall, the post-2023 evolution highlights a structural shift in the US market: while Single-underlying deals continue to grow in absolute terms, multi-underlying structures are increasingly favoured at the margin, driving the observed market share rebalancing.
Market Share Breakdown: Single, Worst-of and Basket deals
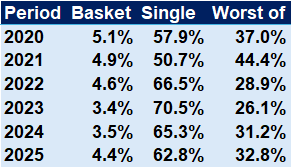
Source: SPI, part of WSD
US Worst-of sales volumes over 2020–2025 exhibit a highly concentrated structural shift, with less than 1% of index combinations (0.66%, or 6 combinations) accounting for approximately 78% of the incremental sales volume in 2025 vs. 2020, clearly evidencing a strong Pareto distribution. Within this narrow set, the NDX Index / RTY Index / SPX Index combination overwhelmingly dominates, rising from USD 3.9Bn in 2020 to USD 17.2Bn in 2025, and alone contributing USD 13.3Bn of incremental volume, making it the primary growth engine of the US Worst-of market. The RTY Index / SPX Index duo also gained significant traction post-2020, nearly doubling to around USD 7.0Bn by 2024, but issuance plateaued in 2025. The INDU Index / RTY Index / SPX Index combination has grown moderately, adding USD 1.7Bn since 2020. However, it continues to expand into 2025, indicating a still-developing growth profile, although with a materially smaller absolute contribution than the dominant NDX-led structure.
Most popular ‘Worst of’ combinations by sales volume (USDm)

Source: SPI, part of WSD
The continued expansion of the U.S. structured products market reflects a combination of supportive issuance conditions and evolving investor behaviour. In an environment characterized by higher-for-longer interest rates and persistent market uncertainty, structured products are being used through a broader range of portfolio applications. Market participants have adjusted multiple design parameters, including underlying selection, investment horizon, capital protection features, and payoff structures such as multi-underlying and worst-of formats, to align risk-return profiles with changing macroeconomic and market conditions.
This shift has coincided with continued market growth, with U.S. issuance reaching USD 226bn in 2025 (+14.1% year-on-year), and projections indicating issuance could exceed USD 250bn in the coming year. As structured products continue to be employed for yield generation, risk management, and scenario-specific positioning, their presence in portfolio construction is expected to expand further, contributing to the ongoing development of the U.S. market.
METHODOLOGY
Data Coverage and Scope
This report is based on publicly available U.S. structured notes issuance data and reflects issuance activity from January 2020 through 2025, unless otherwise stated.
The dataset includes:
• All SEC shelf-registered structured notes issued in the U.S. market during the period.
• Products linked to equities, equity indices, interest rates, and other eligible reference assets.
Key product characteristics, including:
Issue date and maturity
Underlying asset(s)
Coupon structure and coupon observation features
Capital protection features
Callability and barrier mechanics
Upside participation and downside payoff profiles
Product format (single underlying, worst-of, basket)
Definition of a Structured Product
SPi defines a structured product as any investment instrument that:
• Provides a return linked to the performance of one or more underlying assets, which may include equities, indices, funds, interest rates, currencies, commodities, or other reference assets; and
• Has pre-defined payoff terms, including explicit upside participation, downside exposure, and capital protection characteristics.
Data Sources
• Primary source: Publicly available pricing supplements and related documentation published on the SEC EDGAR website.
• Secondary inputs: Independent research, data normalization, classification, and calculations conducted by SPi, part of WSD.
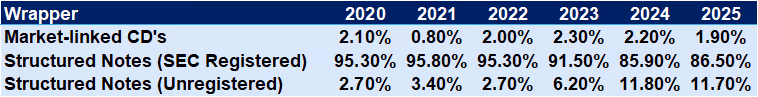
• The table below presents the breakdown of U.S. structured product wrappers by market share:
Issuance and Volume Calculations
• Products are analysed based on their issue date.
• Issuance volumes are calculated using the notional amount issued, expressed in USD millions.
• Where relevant, volumes are aggregated:
o By calendar year of issuance
o By product type (capital protected, growth, income)
o By region and asset scope
o By underlying asset or underlying combination
• Percentages are shown as whole numbers or rounded to the nearest one decimal place, depending on context.
Underlying Classification
• Underlyings are classified by asset class, geographic exposure, and index or single-stock reference.
• For products with multiple underlyings:
o Single underlying refers to products linked to one reference asset.
o Worst-of refers to products whose payoff depends on the lowest-performing underlying within a predefined set.
o Basket refers to products linked to a weighted or averaged combination of underlyings.
• Given the large number of unique underlying combinations, league tables and charts display only the most significant underlyings or combinations by issuance volume. All remaining underlyings are aggregated and reported as “Other.”
Performance Metrics
• The average lowest underlying level represents the average performance of the least-performing underlying (relative to its initial level) across all products referencing that underlying over their life to date.
• This metric is expressed as a percentage of the initial underlying level at issuance and is intended to provide a standardized indication of performance across products.
Market Share Analysis
• Market share figures are calculated as the proportion of total issuance volume attributable to a given category (e.g., region, asset scope, product type) within the relevant period.
Presentation and Ordering
• League tables and rankings are ordered from highest to lowest issuance volume.
• Charts and tables may not sum to exactly 100% due to rounding.
• All figures are presented in nominal terms and are not inflation-adjusted.
Limitations
• As the data is sourced from external public disclosures, SPi cannot guarantee the completeness, timeliness, or absolute accuracy of the dataset.
• The analysis reflects primary issuance activity only and does not capture secondary-market trading or investor-level holdings.
• Interpretations reflect observed issuance behavior and should not be construed as investment advice.


