
An SP Intelligence White Paper: why the buffer ETF, the '40 Act wrapper's mature reference case, is now the larger venue for defined-outcome protection than the buffered note, and what that implies as autocallable income ETFs attempt the same migration.
Buffer ETFs now hold more assets than buffered notes , the clearest proof yet that the wrapper has built a durable rail for defined-outcome payoffs. First Trust, a large wholesaler distributing both formats at scale, shows how that rail is reallocating capital inside a single book. Autocallable and equity-linked income ETFs are the next test of the same infrastructure, running income and path-dependent risk where buffers ran protection.
1. Introduction
SPI's market data points to a structural shift in where defined-outcome demand is forming: out of the bank-issued note and into the '40 Act ETF wrapper. Buffer ETFs are the proof case. They are the most established structured ETF category, the one with the longest track record and the deepest dataset, and they have just done something buffered notes have never had to contend with before: they have overtaken them in outstanding assets. That single crossover is the anchor of this paper. Buffer ETFs proved the wrapper could deliver a defined-outcome equity payoff with daily liquidity, and in doing so built the operational, regulatory, and distribution rail that any later structured ETF inherits. Autocallable and equity-linked income ETFs are the second wave testing that same rail, this time against income and path-dependent payoffs rather than protection.
These are two distinct families, not one product evolving, and this paper treats them that way: buffers first, in depth, because that is where the data is most mature; then First Trust as a single case study, because it is the longest-standing wholesaler distributing both formats at meaningful scale and therefore the cleanest read on how one book reallocates between them; then autocallable ETFs, which are still too young to support the same granularity but can be read against the template the buffer wave has already established. A buffer and an autocall are different instruments for different buyers, protection-first versus income-first, and they stay that way inside an ETF. What carries from the first wave to the second is not the payoff, but the wrapper's capability set. Buffers established that option-based, outcome-over-a-period exposure clears daily creation and redemption, prices cleanly at NAV, and onboards onto RIA platforms. Autocalls do not have to re-prove any of that. Two distinct product families now sit on one shared piece of market infrastructure, and that infrastructure is what the buffer wave built.
For a structured products desk the relevant consequence is disintermediation. Economics that used to live inside a bank's structured note (issuance margin, the hedging book, the funding leg) get re-sliced when the same risk is manufactured inside an ETF. The bank may recapture part of it as the swap counterparty or ELN supplier to the fund, or it may lose the primary issuance relationship entirely. Which of those happens, and how far it has already happened in the buffer market, is the strategic question this paper sets out to answer.
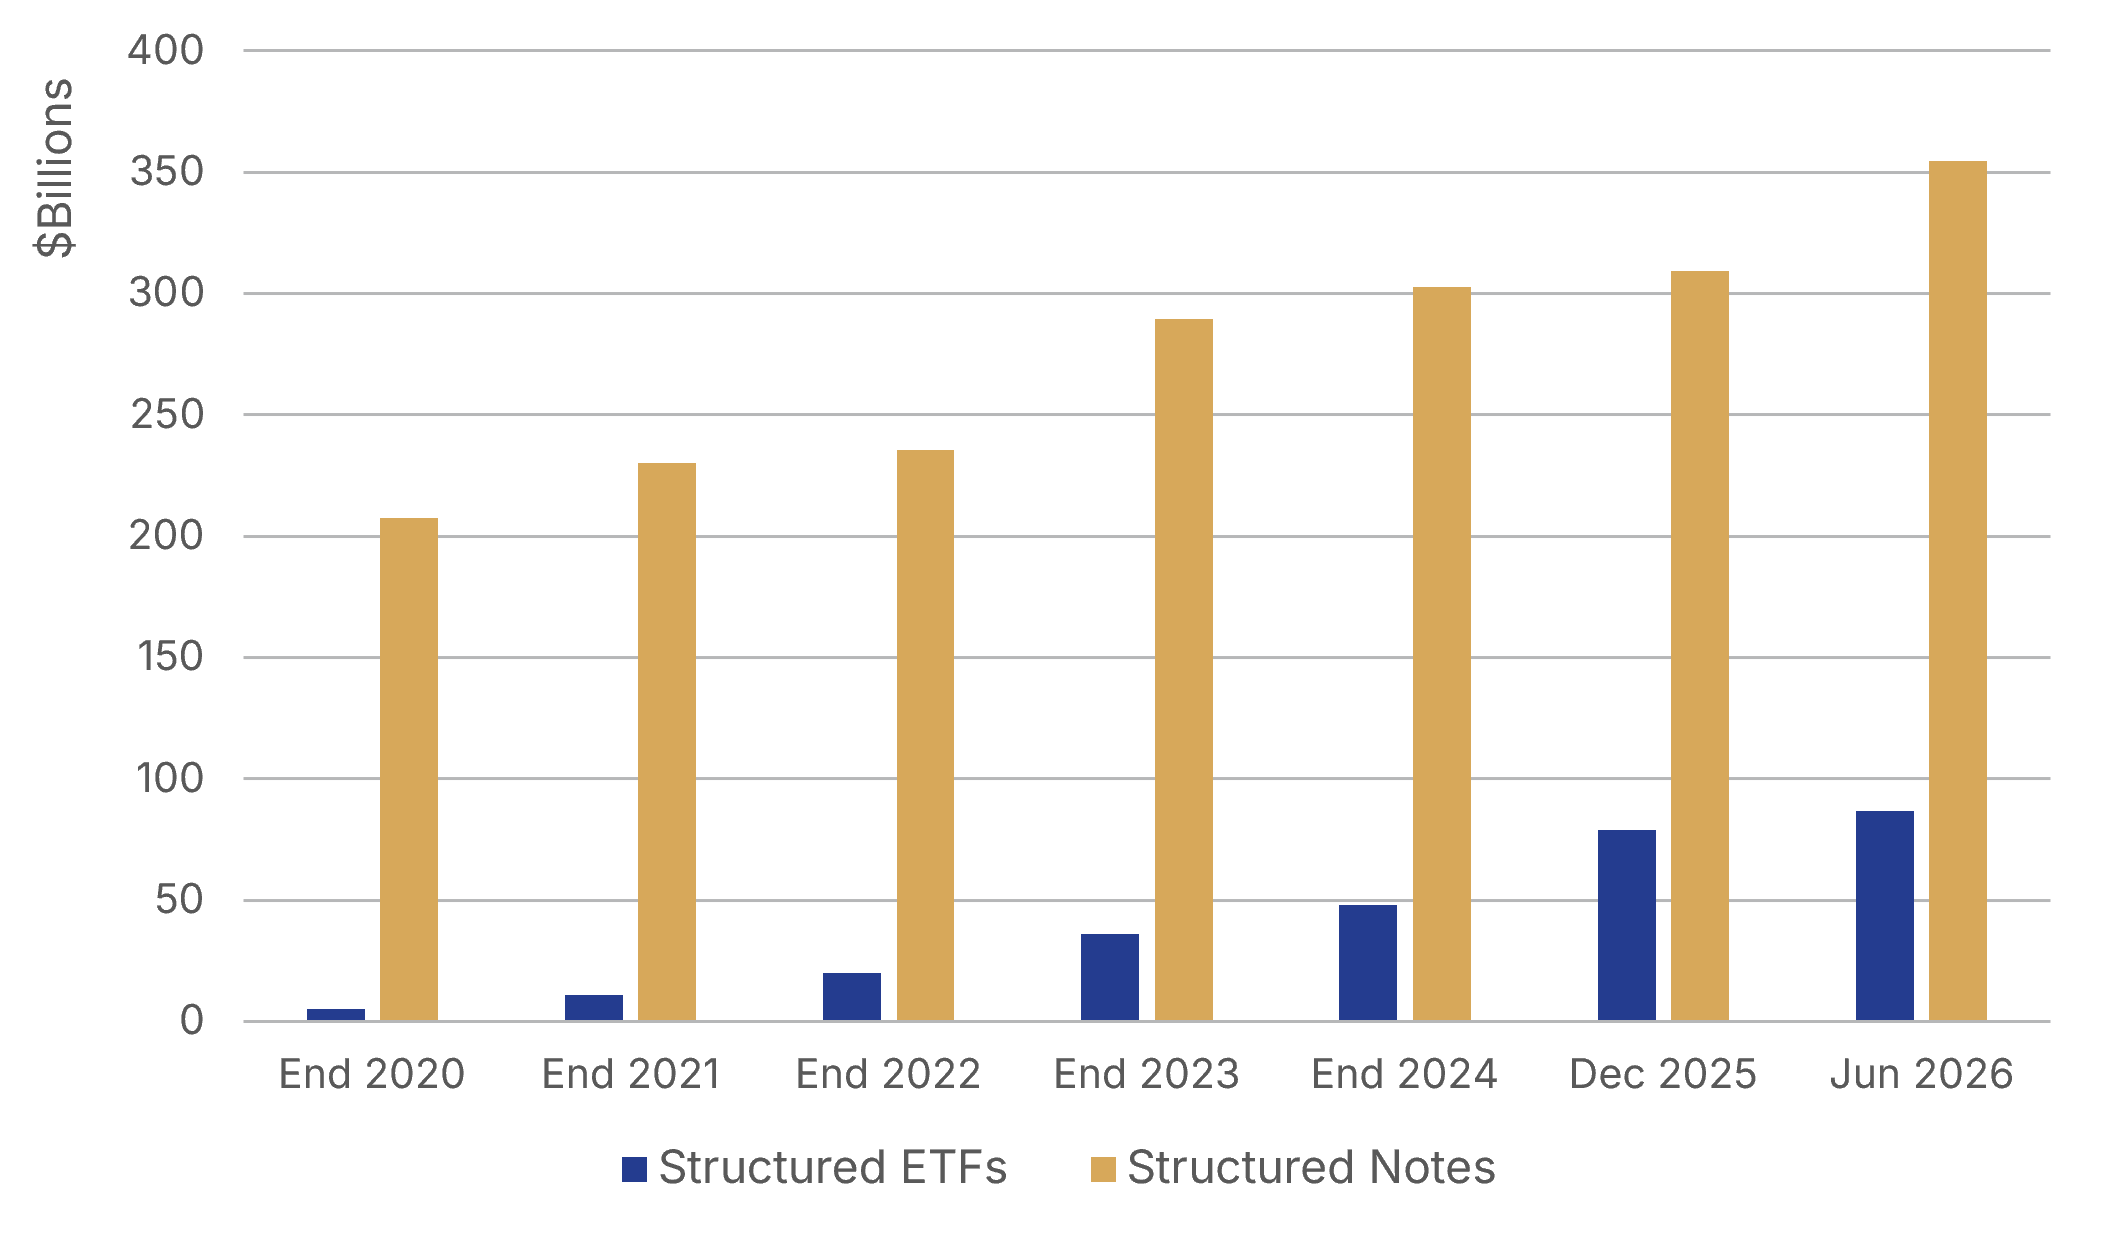
Exhibit 1: Structured Notes vs Structured ETFs AUM, 2020 to Jun-26
Source: SP Intelligence (part of WSD), Morningstar.
Key points
• Buffer ETF assets overtook buffered note outstandings for the first time in 2025 and led by USD 84.5bn to USD 79.0bn as of June 2026. This is the clearest single sign that the protection-first payoff is now carried more by the wrapper than by the note.
• Buffer ETF category AUM grew from roughly USD 5bn at end-2020 to USD 84.5bn by June 2026, close to a seventeenfold increase, making it the mature reference point for structured ETF adoption.
• The autocallable and equity-linked income ETF universe is roughly USD 2.43bn, more than an order of magnitude smaller and still early-stage, but with several funds at meaningful scale (CAIE near USD 1bn, ACYN above USD 500m).
• The two families differ in payoff, in buyer, and, critically for the desk, in how the payoff is manufactured. Buffer ETFs lean on cleared FLEX options. Autocallable ETFs, being path-dependent, lean more on swaps and ELNs, which reintroduces bilateral counterparty risk that the buffer wave had largely engineered out.
• Underlying design is the primary structuring lever in the income wave. Worst-of baskets, decrement indices, vol-control indices, and single stocks are not incidental. Each is a deliberate choice to manufacture coupon, and each carries a cost the headline yield does not display.
2. Buffer ETFs: From Note Distribution to the ETF Wrapper
a. Buffered Notes
The structured note has historically been the default delivery vehicle for retail and wealth structured exposure. A bank issues the note, embeds the option package, books the hedge, and distributes through wirehouses and private banks. The ETF wrapper changes the distribution physics. Exchange listing, intraday pricing, daily liquidity, and the absence of a bilateral subscription process lower the friction of holding structured exposure and widen the buyer base from a structured products desk's distribution list to anyone with a brokerage account.
Lowering the friction of holding structured exposure enables disintermediation, and that is what directs the flow. Structured ETFs began with buffer ETFs, and autocallable ETFs are now emerging behind them, but that sequence sits inside a larger migration: structured payoff demand is increasingly forming in the ETF wrapper rather than in the bank note (Exhibit 2).
The disintermediation is not total, and that is the part that matters for issuer strategy. When an ETF sponsor manufactures an autocallable payoff through a swap or an ELN, a bank is still on the other side. The bank's role shifts from primary note issuer, capturing issuance margin and owning the client relationship, to wholesale risk supplier to the fund, capturing a hedging and financing spread but ceding the relationship and the issuance economics to the ETF sponsor. Some franchises will defend the note, some will supply the wrapper, and the margin profiles of those two strategies are not the same.
Exhibit 2: Buffered notes outstanding volume vs Buffer ETF AUM, 2020 to H1 2026.
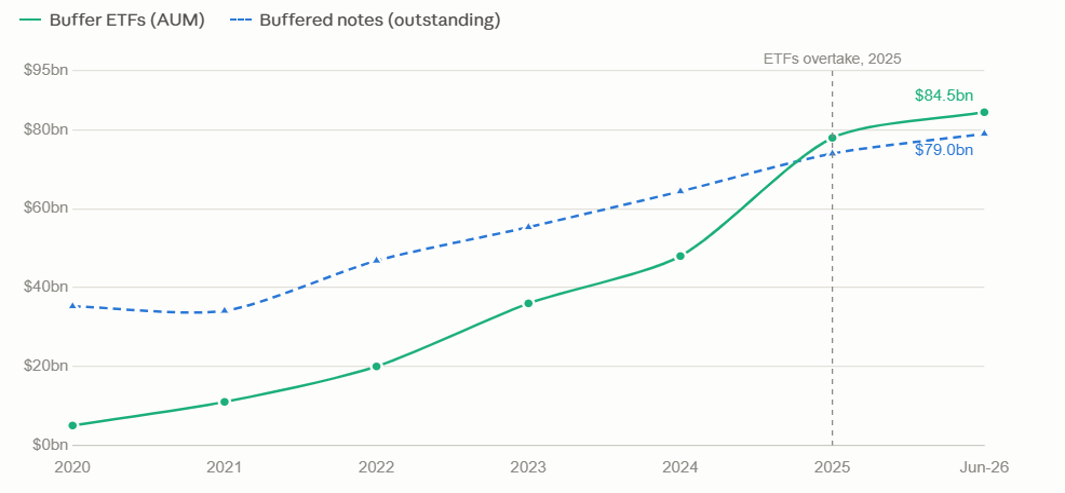
Source: SP Intelligence (part of WSD), Morningstar.
Buffer ETF assets overtook buffered note outstandings for the first time in 2025 and extended the lead through the first half of 2026. As of June 2026, buffer ETFs held USD 84.5bn against USD 79.0bn in buffered notes, having begun the period at barely one seventh the size of the note market. Over five and a half years buffer ETF AUM compounded at close to 67% a year, a near seventeenfold increase, while buffered note outstandings little more than doubled at a mid-teens growth rate. The ETF share of the combined buffer market, notes outstanding plus ETF AUM, rose from around 12% in 2020 to roughly 52% by mid-2026, crossing the halfway mark in 2025. The protection-first payoff that the note market originated is now carried more by the ETF wrapper than by notes.
Case study: First Trust
First Trust is active on both sides of the buffer market, distributing buffered notes while ranking among the largest buffer ETF providers, which makes its book a useful gauge of where structured capital is forming. The data does not show a rotation. First Trust's buffered note outstandings grew by 46% over the six quarters to Q2 2026, from about USD 2.9bn to about USD 4.3bn. Across the same period the firm's buffer ETF assets, measured only across its funds in the top 25 of the market and therefore understated, grew from about USD 18.5bn to about USD 29.0bn, holding at roughly six to seven times the size of the note book throughout. Close to 90% of the net new assets gathered across both structures accrued to the ETF wrapper. With both books expanding at broadly similar rates, the divergence is primarily a base effect, with the structured ETF segment growing somewhat faster. The note business is growing, but as a small adjunct to an ETF franchise that is several times its size and capturing almost all of the incremental flow.
Exhibit 3: First Trust buffered note outstandings vs aggregate AUM of First Trust buffer ETFs in the market top 25 (a floor for the firm's true ETF total).

Source: SP Intelligence, part of WSD and Morningstar.
3. Autocallable ETFs
Autocallable notes are the backbone of the US structured products market, accounting for 43.8% of total outstanding volume. The autocallable and equity-linked income ETF segment, by contrast, totals roughly USD 2.43bn as at end of June.
This size gap should be interpreted in context. Autocallable ETFs are not a mature category but a very recent wrapper innovation: the first U.S. autocallable ETFs only came to market in 2025, effectively converting a traditionally bank-issued, adviser-distributed payoff into a listed, daily-traded fund format. As a result, the current asset base is still small in absolute terms, but growth has been rapid from a near-zero base. The early adoption curve suggests that investors are responding to the combination of high stated income, simplified access, and portfolio-level laddering, even though the category remains too young to have been tested across a full market cycle.
Exhibit 4: Autocallable notes outstanding volume vs AUM of Autocallable ETFs, Q2 2025 to Q2 2026
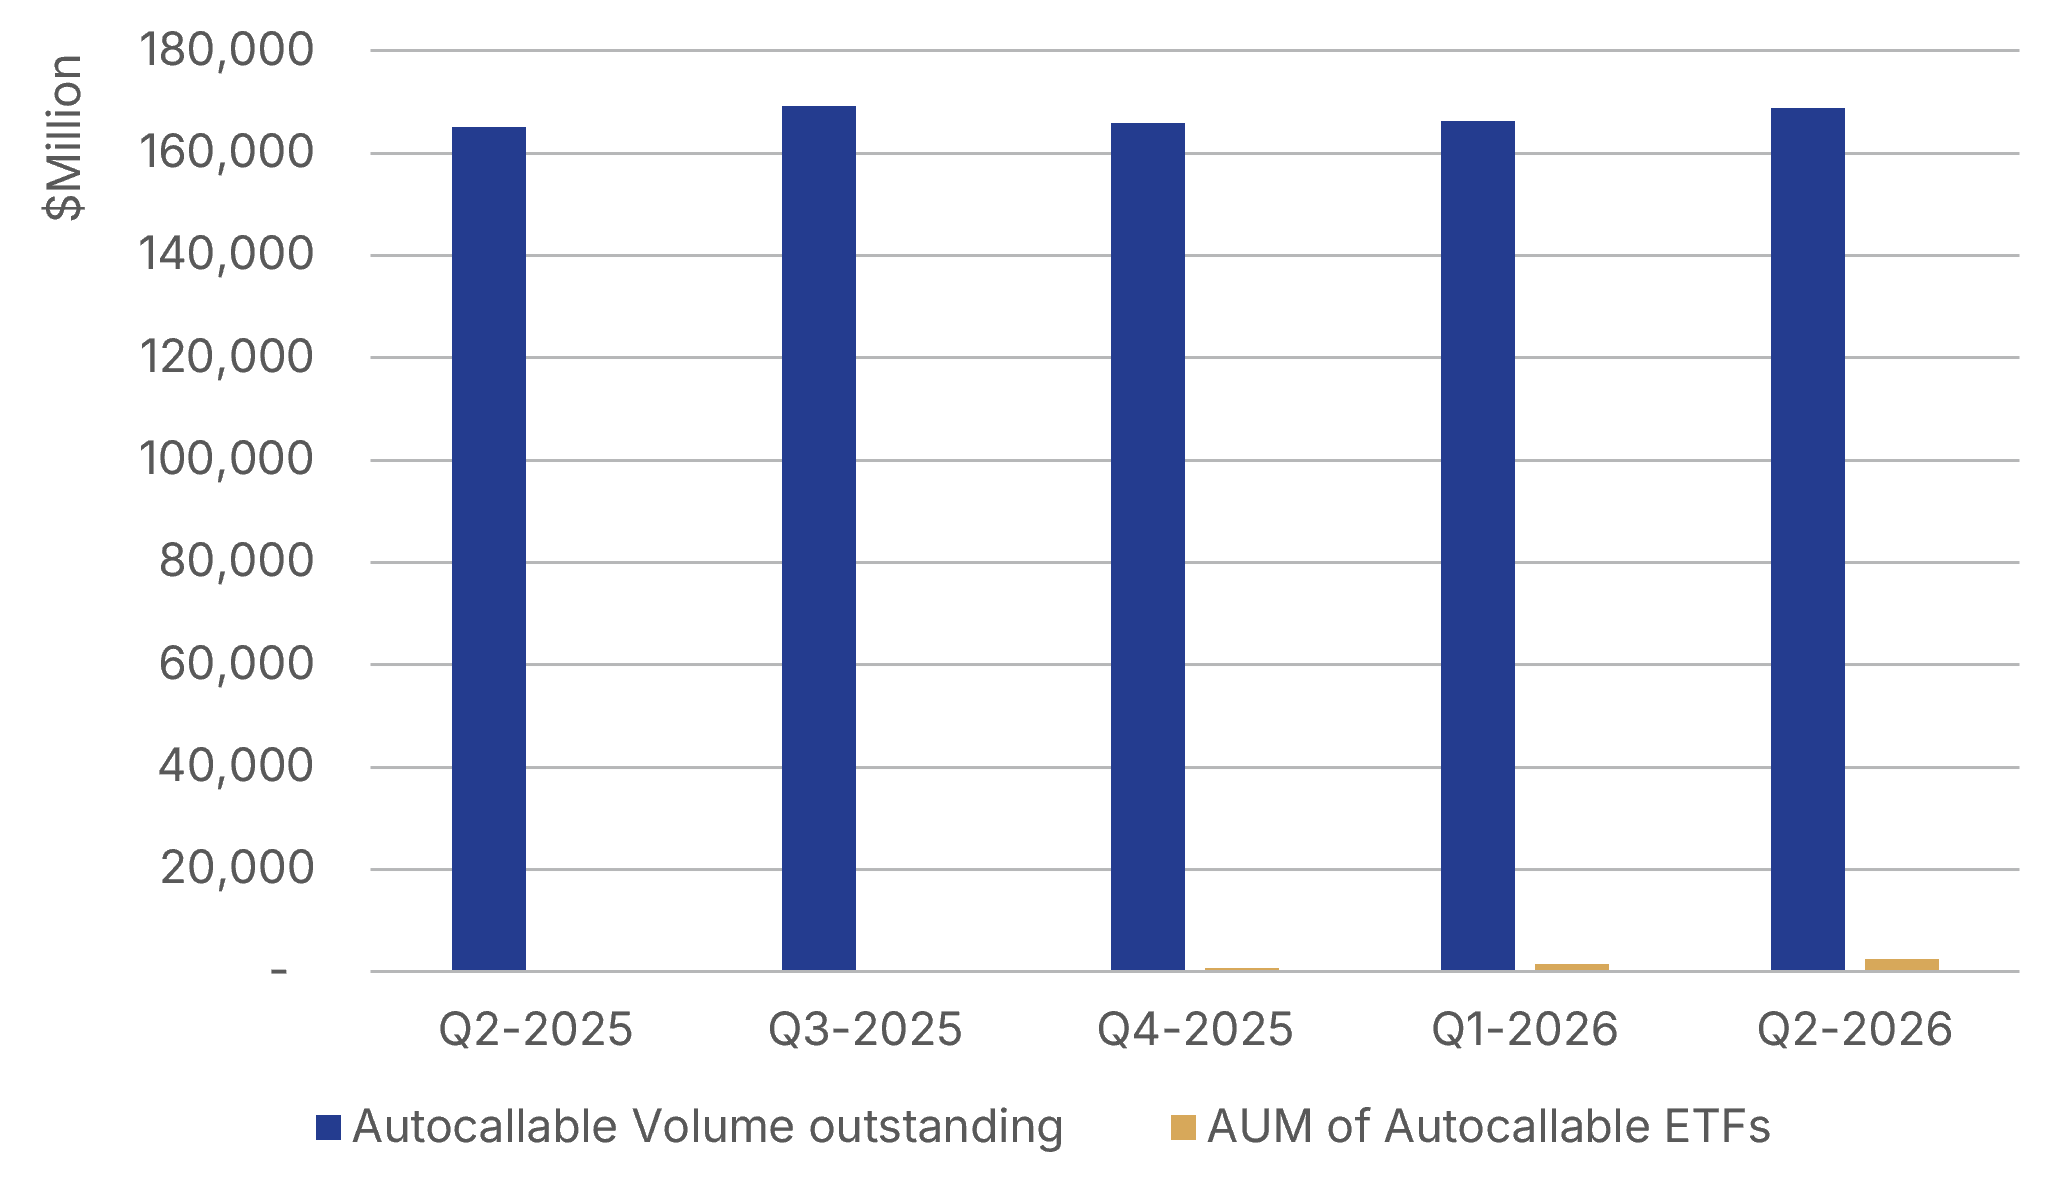
Source: SP Intelligence, part of WSD and ETF Action.
4. What migrates and what stays: the tenor split
If the wrapper is superior on liquidity, credit, tax, and friction, the obvious question is why buffered note outstandings are still growing at all. The question presumes that superiority on those axes should produce displacement, but it produces displacement only between instruments competing for the same dollar and for most of the note book the two do not. Buffered notes and buffer ETFs are not dividing a fixed pool; both draw on a defined-outcome category that is expanding, and each takes the part of that expansion its structure fits. Since 2020 buffer-ETF assets have grown by roughly $80bn against roughly $44bn for buffered-note outstandings, and the note book has grown in every tenor bucket, adding the most, in dollar terms, at the short end, the very segment a one-year ETF most closely substitutes. Were the ETF converting the short end, the short end would be the one part of the note book in retreat; instead it is the fastest-growing in absolute size, adding $21bn since 2020.
What the buffer ETF can replicate is precise and narrow. Its defined outcome is struck over an approximately twelve-month period and re-struck annually at prevailing volatility, so as a payoff-for-payoff substitute it reaches only the most standardized cell of the note market: a vanilla buffer on a major index, struck for about a year. For that cell the contest is real and the ETF wins it; most decisively for the buyer already rolling a fresh one-year note every twelve months, the lowest-friction convert there is. But that cell is one slice of the short end, not the whole of it. Across every tenor, including the zero-to-two-year bucket, much of the note book is exposure the fund does not offer: worst-of and single-name underliers, geared and deeper buffers funded by a multi-year option budget, digital and dual-directional payoffs, terms locked to maturity rather than reset each year at the prevailing cap, and entry timed to a chosen level of volatility. An annually re-struck index fund is none of these. That is why the most substitutable part of the curve has kept growing rather than hollowing out: the ETF competes for one cell inside it, not for the whole.
Therefore, this is not rotation, not notes-in-general giving way to ETFs, and not a commoditized short-tenor slice migrating into the wrapper while a bespoke long-tenor slice stays behind. Both books are growing at once because the category beneath them is growing, and the strongest claim the relationship will bear is that the ETF has taken the larger share of that growth because for its standardized one-year core it is the better instrument. The structural fact that anchored the original argument survives intact: the buffer ETF is a one-year, annually re-struck instrument, and that genuinely bounds what it can ever replace. What it has not done is convert that bound into a tenor-segmented migration. This is why a stakeholder present in both wrappers, First Trust among them, can grow both books at once: it is not splitting a market between them but supplying two forms of demand within one expanding category, the standardized exposure the ETF now serves best and the customized exposure for which the note remains the better or the only instrument.
Exhibit 5: Buffer Notes outstanding volume by tenor ( in USDm)
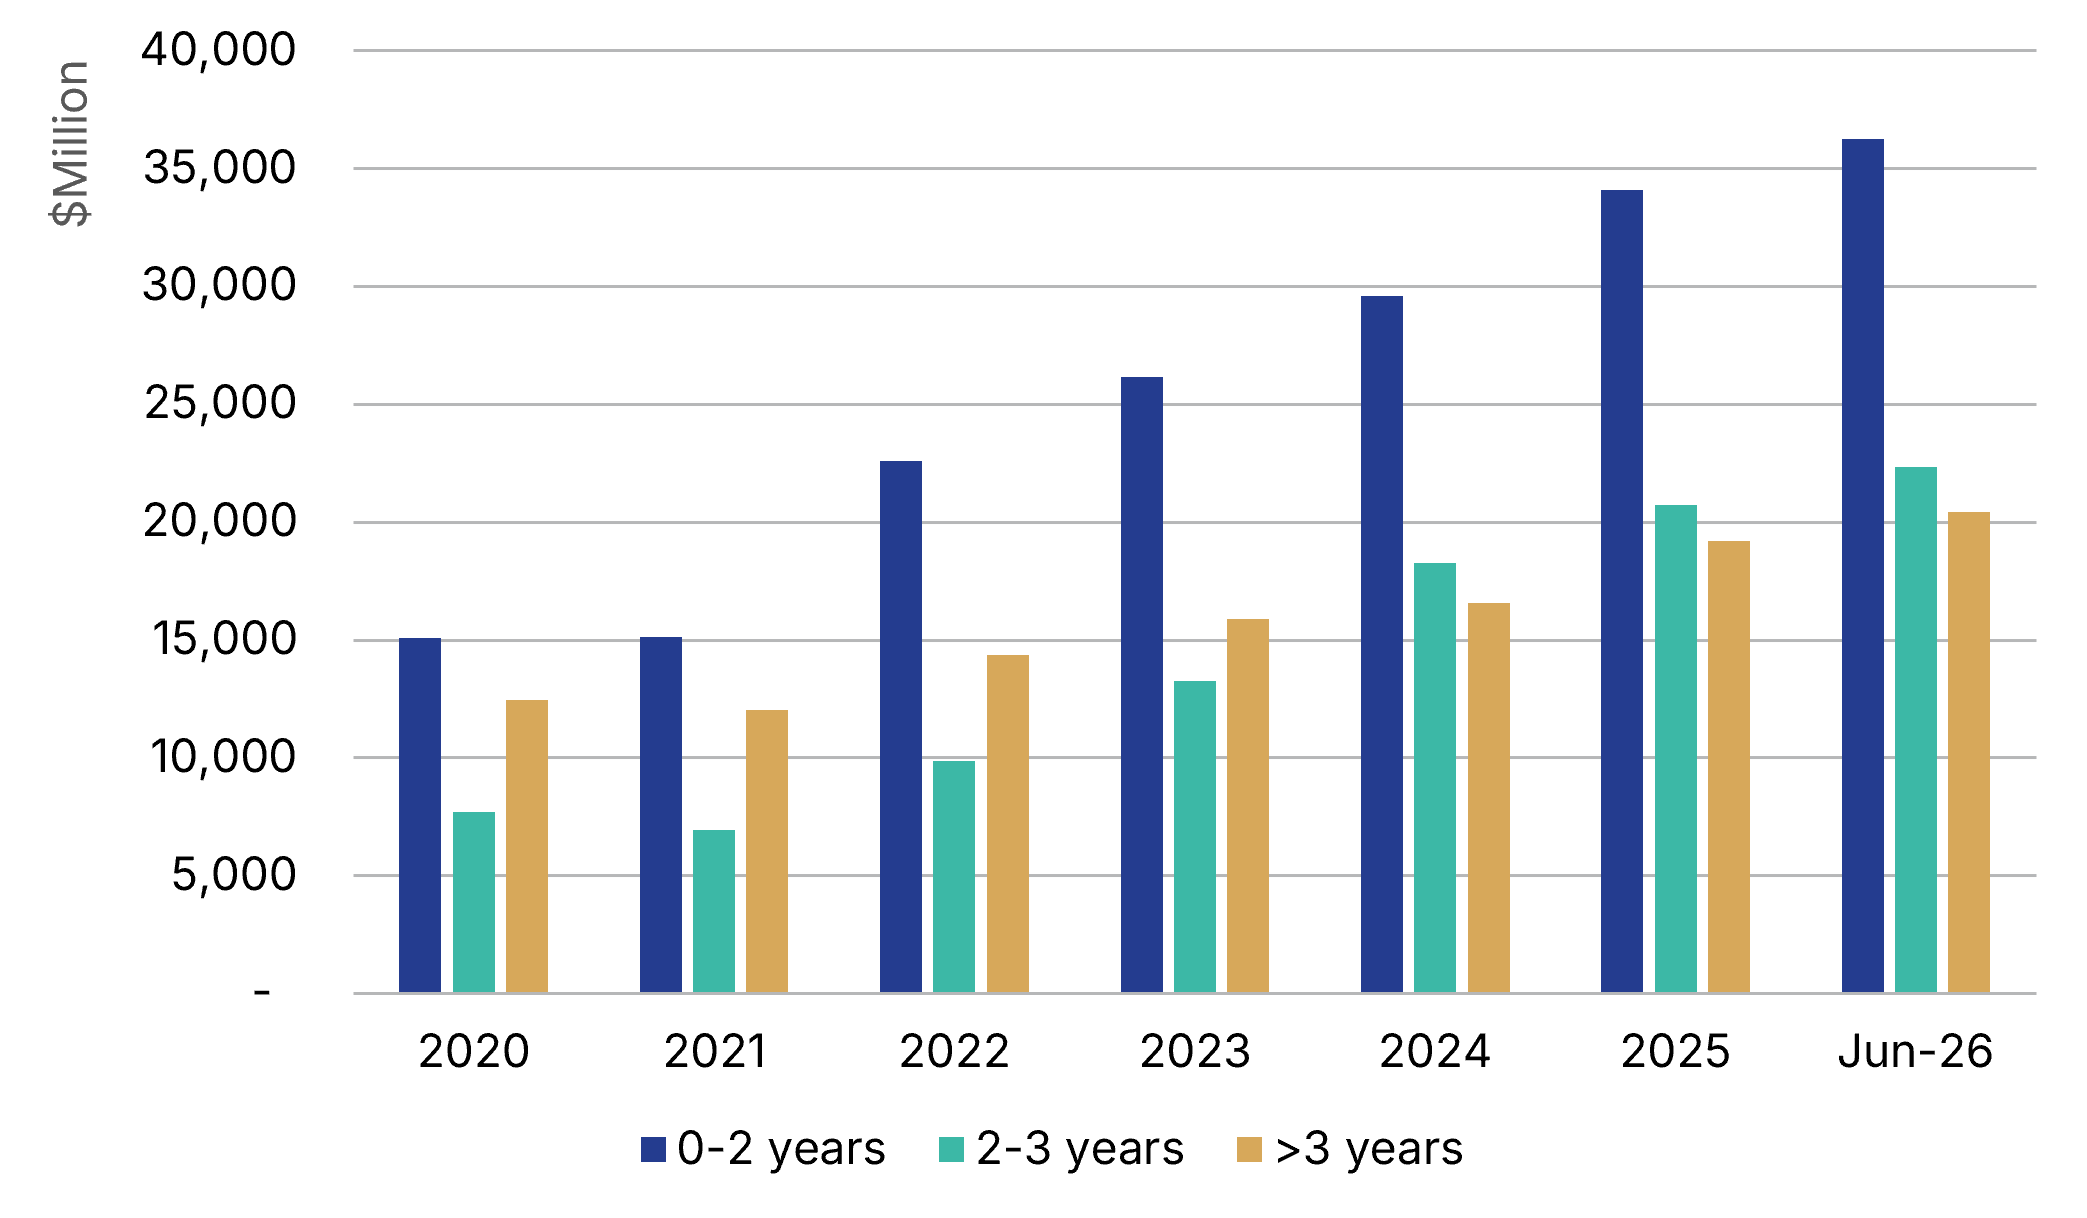
Source: SP Intelligence, part of WSD.
5. Two Families on One Rail
Buffer ETFs and autocallable ETFs are routinely shelved together as "structured ETFs," but they are different instruments solving different problems. Treating them as interchangeable is the most common analytical error in the category.
Buffer ETFs are protection-first. Over a defined outcome period the fund delivers reference-index upside to a cap in exchange for absorbing a defined slice of downside. The underlying is vanilla and the structure lives entirely in the option spread. The buyer is making a risk-managed equity allocation decision.
Autocallable and equity-linked income ETFs are income-first. The fund manufactures a coupon from structured-note-style payoffs: conditional coupons above a barrier, an autocall feature that can redeem early, and downside that turns on at a knock-in. The underlying is frequently not vanilla, and that is deliberate. The buyer is making a yield-enhancement or income-replacement decision, not an equity-allocation decision.
The one thing to be unambiguous about: a buffer ETF is not an autocallable product. It has no autocall observation schedule, no conditional coupon barrier, and no early-redemption mechanic. It is a defined-outcome equity product. The two families share a wrapper and a regulatory lineage, not a payoff.
Exhibit 6: Buffer ETF vs Autocallable ETF: payoff, replication, and buyer profile compared
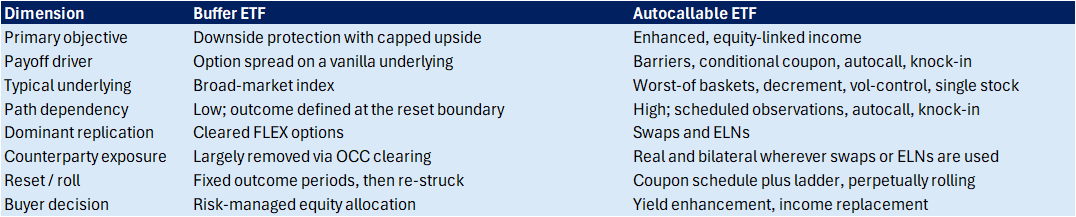
Source: Bloomberg
6. How the payoff is manufactured
The question is not "what is the payoff" but "how is it built and who warehouses the risk." It is worth being precise on the point the marketing language tends to obscure: these ETFs generally do not hold autocallable notes. They reconstruct the payoff through one of three routes, and the choice carries direct counterparty and capacity implications.
FLEX options. Exchange-listed options with customizable strike and expiry, cleared through the OCC. This is the dominant route for buffer ETFs. The cap and buffer are assembled from a layered option spread on the reference index or its ETF proxy. Some relevant features: OCC central clearing largely removes bilateral counterparty risk; the defined outcome only holds at the reset boundary, with mid-period NAV moving on the mark of the option book; and the cap and buffer re-strike each outcome period at prevailing volatility, so caps compress when vol is low and richen when vol is high. A buffer ETF's terms are, in effect, a running short-vol position dressed as a defined outcome.
Swaps. The fund holds a total-return or payoff swap with a bank counterparty. Counterparty exposure here is real and bilateral, collateralized but present. This route dominates where the payoff is path-dependent or references a custom, decrement, or vol-control index that listed options cannot replicate cleanly. Most autocallable economics fall into this bucket.
ELNs. The fund holds equity-linked notes issued by banks. This is the route that most resembles the legacy note world, simply intermediated by a fund rather than sold directly to the end client. Counterparty and note-credit exposure is direct. This is the origin of the counterparty and ELN due-diligence questions that belong in any serious assessment of an income ETF.
The asymmetry between the two families follows from this. Buffer payoffs are static and replicable with cleared listed options, so the buffer wave largely engineered bilateral counterparty risk out of the product. Autocallable payoffs are path-dependent, which is hard to express in listed options, so the income wave leans on swaps and ELNs. The practical conclusion: the income wave carries materially more bilateral counterparty risk than the protection wave did, and the counterparty roster is a first-order due-diligence item for autocallable ETFs in a way it never really was for buffers.
(The replication mix varies by issuer and by fund. The general shape above holds, but the specific method for any named fund should be confirmed from its prospectus and holdings, since it drives the counterparty profile the buyer inherits.)
7. Underlying Design as the Structuring Lever
In a buffer ETF the underlying is a transparent benchmark (SPX, NDX, RUT, increasingly single-country and single-name variants) and the structuring sits in the option spread. In an autocallable ETF the underlying is itself the principal structuring lever. The coupon an income ETF advertises is manufactured by the choice of reference asset at least as much as by the barrier levels, and each lever carries a cost the headline yield does not display.
Worst-of baskets (typically SPX, RTY, NDX). Referencing the worst performer of a basket harvests dispersion and correlation premium, which funds a higher coupon. The cost is correlation risk: the protection weakens precisely when markets sell off together and dispersion spikes, which is exactly when the knock-in is most likely to be tested. The advertised coupon is compensation for being short correlation.
Decrement indices. A synthetic fixed dividend or fixed percentage is subtracted from the index return, which cheapens the embedded option and lifts the coupon. The cost is a persistent drag on the reference level that compounds against the investor over time and is easy to underweight when comparing headline coupons. S&P 500 futures decrement constructions appear in the universe.
Volatility-controlled and volatility-target indices. A vol-target overlay (MerQube and similar methodologies appear in the universe) stabilizes the hedge and improves pricing, which again supports the coupon. The cost is mechanical underperformance in trending markets, where the overlay de-risks into strength and re-risks late.
Single stocks (NVDA and TSLA appear in the universe). High single-name implied vol funds a richer coupon than an index can. The cost is idiosyncratic gap and event risk concentrated in one name, with a knock-in that a single earnings print can trip.
The due-diligence point is the interaction of these levers with the wrapper. A decrement or vol-control underlying inside a perpetually rolling, daily-NAV vehicle behaves differently from the same underlying inside a fixed-tenor note held to maturity. The reset and roll mechanics, not the headline coupon, are where the scrutiny belongs.
8. Market Sizing and Adoption
Buffer ETFs are the mature benchmark, and Exhibit 2 is the reference curve against which any structured ETF adoption claim could be measured. The question for the second wave is how far it has travelled along the same axis.
On a relative basis the income wave is roughly 3% of the buffer category. That ratio is the cleanest single statement of where the second wave sits: real, funded, and growing, but well short of maturity. The buffer curve is the bull case for what the income curve could become if the same adoption mechanics hold, though, as the mechanics in Section 6 show, those conditions are not guaranteed to repeat.
9. Competitive Landscape
Buffer ETFs. The category is led by FT Vest and Innovator, whose laddered and monthly outcome-period series account for most of the top names, with Calamos among the more recent entrants. Differentiation is mature and largely operational: ladder frequency, outcome-period menu, cap and buffer calibration, and fees.
Autocallable and income ETFs. The issuer set is broader and less settled: Calamos, FT Vest / Vest Financial, Simplify, TrueMark, Innovator, REX, Janus Henderson, VegaShares, and GraniteShares, among others. Differentiation here is structural rather than operational, and that is where the competitive interest sits:
• Replication method (cleared FLEX versus swap versus ELN), which determines the counterparty profile the buyer inherits.
• Underlying design (broad index versus worst-of versus decrement versus vol-control versus single-stock).
• Barrier and coupon calibration, and how aggressively the coupon is pushed against knock-in probability.
• Ladder frequency and the resulting reinvestment and reset behavior.
• Counterparty roster and concentration for the swap and ELN cohort.
• Fees, liquidity, and secondary-market depth.
The buffer market competes on execution of a settled design. The autocallable market is still competing on the design itself, which is why issuer differentiation there carries more information.
10. Risk and Strategic Implications
The risks worth flagging are the ones specific to running structured payoffs inside a '40 Act wrapper.
For buffer ETFs the live risks are mechanical. The cap is a binding short-vol constraint that compresses in low-vol regimes. Mid-period entry means a buyer rarely receives the stated buffer or cap from their actual cost basis. And the defined outcome is only defined at the reset boundary, not intraperiod.
For autocallable ETFs the live risks are structural and, importantly, partly untested. Counterparty exposure is real wherever swaps and ELNs do the manufacturing. Coupon is conditional, not contractual. Worst-of and decrement underlyings carry the embedded costs described above. And the interaction that has not yet been observed is the important one: a sharp, correlated selloff that breaches knock-ins across the cohort, inside daily-priced, daily-redeemable vehicles holding retail flows. Path dependency, daily creation and redemption, and a retail buyer base have not been stress-tested together. That interaction, not any single risk in isolation, is the thing to watch.
A category-level consideration deserves a place alongside the product risks. With buffer ETFs at roughly USD 84.5bn and external projections running into the hundreds of billions by 2030, it is worth asking whether the plumbing scales. The category is, in aggregate, a very large and mechanically rolled short-volatility position, built from FLEX options whose reset dates cluster on the monthly series calendar. That concentrates demand for specific listed-option exposures on predictable dates, and leans on OCC and FLEX capacity and on liquidity in the underlying options. None of this binds today, but a calendar-driven options footprint of that size is a market-structure factor in its own right, and it is not obviously priced.
The wrapper also exists at the regulator's discretion. These funds operate within Rule 18f-4, which governs registered funds' use of derivatives and their leverage risk, and complex, defined-outcome, and single-stock products draw periodic regulatory attention. The base case is continuity, but a change in how the rules treat option-based or single-name defined-outcome strategies is one of the few developments that could slow the rotation at the category level rather than at the level of any single fund.
For issuers the strategic picture is the disintermediation question made concrete:
• Banks face a choice between defending the primary note franchise and supplying the ETF complex as swap counterparty or ELN issuer. The two have different margins and different relationship economics. They are not mutually exclusive, but they pull in different directions on pricing and capacity.
• The '40 Act wrapper's constraints (daily liquidity, diversification rules, a strong preference for listed and cleared instruments, and portfolio transparency) determine which exotic payoffs wrap cleanly and which do not. Static, index-referenced payoffs wrap easily in FLEX. Path-dependent and worst-of payoffs push toward swaps and ELNs, which reintroduces the counterparty management the wrapper was supposed to simplify.
• There is genuine product-design whitespace in calibrating barriers, decrements, and reset frequency for a perpetually rolling, daily-NAV vehicle rather than a fixed-tenor note. Note conventions do not transfer mechanically, and the issuers who solve the rolling-vehicle calibration well will have a real edge.
A measurement point follows directly, and it cuts against the data the market relies on. As the payoff migrates into the wrapper, the standard note issuance and distributor league tables increasingly mismeasure a bank's true structured footprint. A bank that loses primary note issuance but picks up the swap or ELN supply to an ETF shows a falling league-table rank while its actual structured-payoff economics may be flat or growing through the ETF channel, because that revenue never registers as note issuance. The aggregate rotation is measurable, since note outstandings can be set against ETF AUM, but the bank-level reallocation of who earns what is partly invisible in the conventional data.
Outlook
The most important finding in the buffer data is what did not happen. Buffer ETF assets overtaking buffered note outstandings might read as displacement, but the notes AUM grew throughout the same period, including at the short end, the segment the ETF most directly substitutes. The simplest explanation is the right one: the two formats do not share a distribution channel in any meaningful way. Buffered notes reach investors through structured products desks, private banks, and wirehouse advisors already operating in the space. Buffer ETFs reach RIA platforms, self-directed accounts, and retail brokerage, buyers who were never in the note market to begin with. The ETF wrapper did not convert the note buyer; it found a different one. Structured payoffs got to new investors, and both markets grew as a result.
This reframes what the buffer wave actually proved. It was not a demonstration that the ETF wrapper beats the note for the same buyer. It was a demonstration that a defined-outcome payoff, made exchange-listed and daily-liquid, opens a distribution channel the note cannot reach. The wrapper expanded the category; it did not cannibalize it.
There is a temptation to read the buffer adoption curve as a template for autocalls. The mechanics argue against it. The buffer crossover happened precisely because the payoff is static and FLEX-replicable, which let the wrapper clear bilateral counterparty risk and fit the '40 Act cleanly. Autocalls are path-dependent, which forces swaps and ELNs, which reintroduces the very counterparty risk the buffer wave removed and makes the wrapper fit harder. The feature that powered the first wave is therefore absent from the second, so the buffer curve is a weak template for autocalls, not a strong one. The income wave may still scale, but it has to do so against a structural headwind the protection wave never faced.
It scales if it can demonstrate durable coupon generation, resilience through a genuine stress event, and secondary-market liquidity deep enough to support the daily-redemption promise, supported by advisor education and transparent reporting of the embedded costs.
It stalls if the first real barrier-breach cycle produces losses that the conditional-income framing had obscured for the end buyer, if counterparty concentration in the swap and ELN cohort becomes a visible concern, or if the products underperform sharply enough in a correlated selloff to draw platform and regulatory scrutiny.
Buffer ETFs created the adoption blueprint by making defined-outcome protection clear, cheap to access, and platform-ready. The open question for the second wave is not whether income payoffs can be wrapped, which they plainly can, but whether the wrapped form behaves the way its buyers expect the first time the underlying moves hard against them, and whether it can do so while carrying the counterparty risk the protection wave was able to leave behind.
Appendix: Methodology
Definition of a Structured Product
SP Intelligence (SPI) considers structured products any investments which provide a return based on the performance of an asset. This asset can cover the equity, index, fund, interest rate, currency, commodity or property markets. The payoff and level of capital at risk need to be pre-defined.
Data Coverage and Scope
The analysis in this report is based on a dataset of 390,670 structured products issued in the U.S. market from 2020 to June 2026.
The data includes:
• All SEC shelf-registered structured notes issued since the beginning of 2018, and all 3a2 and RegS structured notes provided to SPI. The data is based on public sources, so figures may vary slightly; SPI aims to deliver the most accurate view of the U.S. structured products market.
• Data fields such as key dates, coupon events, barrier events, call events, upside styles and downside styles.
Sources
• Publicly available pricing supplements published on the SEC EDGAR website.
• Bloomberg, for Structured ETF data.
• Independent research and calculations.
Methodology
• Products are analysed by issue date.
• Volumes are usually given in millions of USD.
• Volumes are provided as whole numbers where relevant or rounded to the nearest one decimal place.
• Percentages are given as whole numbers where relevant or rounded to the nearest one decimal place.
• Volumes are calculated as the total resulting from the number of deals for which the relevant feature applied for the relevant date range.
• Volumes for specific time periods are summed using deal issue dates.
• Percentages shown in graphs correspond to the relative market shares.
• Figures are presented in nominal terms and are not inflation-adjusted.
• League tables and rankings are ordered from highest to lowest issuance volume.
• Charts and tables may not sum to exactly 100% due to rounding.
Underlying Classification
Underlyings are classified by asset class, geographic exposure, and index or single-stock reference. Single underlying refers to products linked to one reference asset. For products with multiple underlyings:
• Worst-of refers to products whose payoff depends on the lowest-performing underlying within a predefined set.
• Basket refers to products linked to a weighted or averaged combination of underlyings.
Given the large number of unique underlying combinations, league tables and charts display only the most significant underlyings or combinations by issuance volume. All remaining underlyings are aggregated and reported as "Other."
Market Share Analysis
Market share figures are calculated as the proportion of total issuance volume attributable to a given category (for example, asset scope, product type, or underlying) within the relevant period.
Limitations
• The data is sourced from public disclosures, and SPI cannot guarantee the completeness, timeliness, or absolute accuracy of the dataset.
• The analysis reflects primary issuance activity only and does not capture secondary-market trading or investor-level holdings.
• Interpretations reflect observed issuance behaviour and should not be construed as investment advice.


