
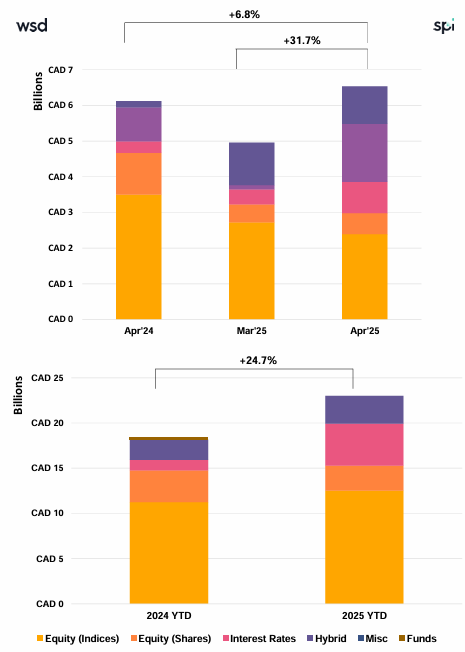
Canada Structured Products Issuance Reaches CAD 6.5Bn (+6.8% YoY) as YTD Growth Remains Strong at CAD 23Bn (+24.7% YoY)
Key Highlights
• Product Split: Structured Notes totalled CAD 3.62Bn (+6.4% YoY), while GICs reached CAD 2.9Bn (+7.2% YoY), reflecting balanced growth across product types.
• YTD Momentum: Volumes reached CAD 23Bn (+24.7% YoY), driven by Structured Notes growth of +37.6%, confirming strong primary issuance.
• Structure Mix: Single-underlying products dominate at 73.7% YTD, vs. 26.1% for baskets, indicating slightly increasing diversification.
• Product Mix: Capital-protected products account for 50%, while Income products represent ~33%, maintaining a protection-heavy allocation.
• Underlying Trends: Equity indices account for 54% of issuance, reflecting continued equity-driven demand, albeit lower concentration vs. prior months.
Market Overview
April data points to a moderation in growth momentum, with issuance reaching CAD 6.5Bn (+6.8% YoY), while year-to-date volumes remain robust at CAD 23Bn (+24.7% YoY). The market continues to be supported by strong Structured Notes issuance (+37.6% YTD), reinforcing the shift toward market-linked products. While capital-protected products maintain a dominant 50% share, the sustained presence of income structures (~33%) highlights ongoing demand for yield. Structurally, the decline in single-underlying share (73.7%) alongside a rise in baskets (26.1%) suggests a gradual move toward more diversified exposures. A key development in April is the sharp resurgence of Capped Protected Participation (+260% MoM), reclaiming the top payoff position and displacing Barrier Phoenix, signaling renewed investor interest in protected growth strategies. Meanwhile, equity index exposure (54%), though still dominant, appears more balanced compared to earlier months. Overall, April reflects a transition phase, with solid YTD growth, evolving payoff preferences, and incremental diversification in product structuring.
Methodology & Notes
This report is based on SPi’s proprietary database of structured products distributed in Canada. Figures reflect best-effort estimates based on available market data at the time of publication.
Disclaimers
Data Disclaimer (Best Effort / Completeness)
The information presented in this report is based on data collected from a variety of public and proprietary sources. While reasonable care has been taken to ensure accuracy, the data may be incomplete, subject to revisions, or may not capture the entirety of the market. SPi makes no representation or warranty, express or implied, as to the accuracy, completeness, or timeliness of the information.
General Disclaimer
This document is provided for informational purposes only and does not constitute investment advice, an offer, or a recommendation to buy or sell any financial instrument or to adopt any investment strategy. The views expressed are those of SPi at the date of publication and are subject to change without notice. Past performance is not indicative of future results.
SPi accepts no liability for any loss arising from the use of this report or its contents.


