
Canada Structured Products Issuance Continues to Expand as Strong Notes Drive YTD to CAD 47.4Bn (+16.2% YoY)
Key Highlights
• Product Split: Structured Notes reached CAD 4.6Bn (+44% YoY), while GICs totaled CAD 3.7Bn (~flat YoY), highlighting continued strength in market-linked issuance.
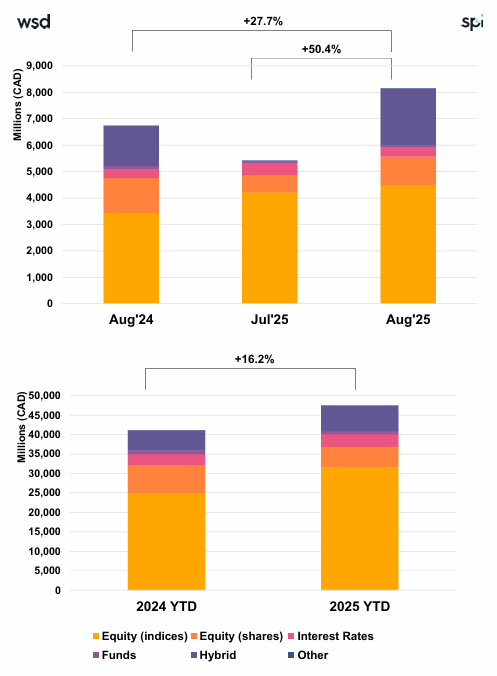
• YTD Momentum: Volumes reached CAD 47.4Bn (+16.2% YoY), supported by sustained growth in Structured Notes.
• Structure Mix: Single-underlying products dominate at 74.4%, vs. 25.4% for baskets, indicating gradual diversification.
• Product Mix: Capital-protected products lead with 48%, followed by Income (35%) and Growth (~17%), with Growth posting a strong +43% YoY increase.
• Underlying Trends: Equity indices dominate at 66.3%, followed by single stocks (11.1%) and rates (6.9%), maintaining strong equity bias.
• Payoff Preferences: Barrier Phoenix (32.5%) and Capped Protected Participation (30.9%) remain co-leaders; Barrier Digital Plus (14.6%) ranks third.
• Payoff Structure Evolution: Fixed-rate products account for 6.6%, while participation-based structures continue to dominate issuance.
Market Overview
August data confirms the continued expansion of the Canadian structured products market, with year-to-date issuance reaching CAD 47.4Bn (+16.2% YoY), driven primarily by strong Structured Notes activity (+44% YoY). While GIC volumes remained broadly stable, the overall growth profile continues to be shaped by the structural shift toward market-linked solutions. The market maintains a balanced product allocation, with capital-protected structures (48%) leading, alongside meaningful shares of income (35%) and growth products (~17%), the latter showing notable acceleration (+43% YoY). Structurally, single-underlying products (74.4%) remain dominant, although the gradual increase in basket usage suggests incremental diversification. The market remains equity-centric, with equity indices accounting for 66.3% of issuance, while allocations to single stocks and rates remain secondary. The continued leadership of Barrier Phoenix (32.5%) and Capped Protected Participation (30.9%), alongside strong demand for Barrier Digital Plus (14.6%), reinforces the dominance of participation-based payoff structures. Overall, August reflects a stable growth environment, characterized by strong note issuance, balanced product allocation, and evolving diversification trends.
Methodology & Notes
This report is based on SPi’s proprietary database of structured products distributed in Canada. Figures reflect best-effort estimates based on available market data at the time of publication.
Disclaimers
Data Disclaimer (Best Effort / Completeness)
The information presented in this report is based on data collected from a variety of public and proprietary sources. While reasonable care has been taken to ensure accuracy, the data may be incomplete, subject to revisions, or may not capture the entirety of the market. SPi makes no representation or warranty, express or implied, as to the accuracy, completeness, or timeliness of the information.
General Disclaimer
This document is provided for informational purposes only and does not constitute investment advice, an offer, or a recommendation to buy or sell any financial instrument or to adopt any investment strategy. The views expressed are those of SPi at the date of publication and are subject to change without notice. Past performance is not indicative of future results.
SPi accepts no liability for any loss arising from the use of this report or its contents.


