
Canada Structured Products Issuance Strengthens as Notes Surge Offsets Weak GIC Volumes, Lifting YTD to CAD 39.3Bn (+14.4% YoY)
Key Highlights
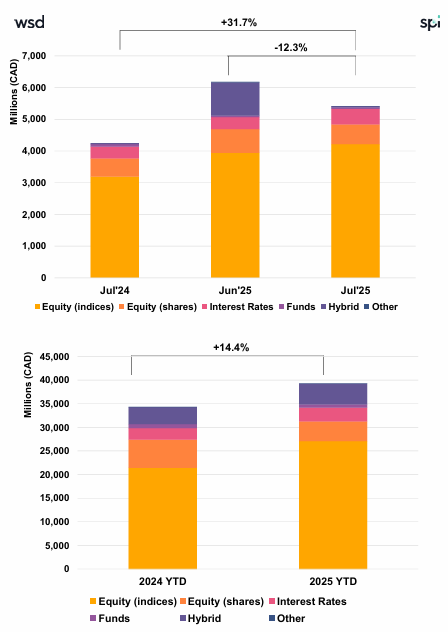
• Product Split: Structured Notes reached CAD 4.3Bn (+75% YoY), while GICs declined to CAD 1.0Bn (-35% YoY), highlighting strong divergence across segments.
• YTD Momentum: Volumes reached CAD 39.3Bn (+14.4% YoY), supported by robust note issuance despite weaker deposit flows.
• Structure Mix: Single-underlying products dominate at 77.3%, vs. 22.6% for baskets, reflecting continued preference for simple structures.
• Product Mix: Capital-protected products lead with 47%, followed by Income (35.7%) and Growth (~17.3%), maintaining a balanced allocation.
Market Overview
July data highlights a strong rebound in Canadian structured product issuance, driven by exceptional growth in Structured Notes (+75% YoY), which more than offset the sharp decline in GIC volumes (-35% YoY). This dynamic pushed year-to-date issuance to CAD 39.3Bn (+14.4% YoY), confirming sustained market expansion. The market remains equity-driven, with equity indices accounting for 68.9% of issuance, while allocations to single stocks and rates remain stable. Product allocation continues to be dominated by capital-protected structures (47%), complemented by strong income product demand (35.7%), reflecting a balanced approach between protection and yield generation. Structurally, single-underlying products (77.3%) remain firmly dominant, underscoring the Canadian market’s preference for simplicity. The leadership of Barrier Phoenix (33.2%), alongside strong demand for Capped Protected Participation (29%) and Barrier Digital Plus (14.6%), confirms the central role of participation-based payoff structures. Overall, July reflects a resilient and expanding market, where strong note issuance continues to drive growth despite cyclical weakness in GICs.
Methodology & Notes
This report is based on SPi’s proprietary database of structured products distributed in Canada. Figures reflect best-effort estimates based on available market data at the time of publication.
Disclaimers
Data Disclaimer (Best Effort / Completeness)
The information presented in this report is based on data collected from a variety of public and proprietary sources. While reasonable care has been taken to ensure accuracy, the data may be incomplete, subject to revisions, or may not capture the entirety of the market. SPi makes no representation or warranty, express or implied, as to the accuracy, completeness, or timeliness of the information.
General Disclaimer
This document is provided for informational purposes only and does not constitute investment advice, an offer, or a recommendation to buy or sell any financial instrument or to adopt any investment strategy. The views expressed are those of SPi at the date of publication and are subject to change without notice. Past performance is not indicative of future results.
SPi accepts no liability for any loss arising from the use of this report or its contents.


