Canadian Structured Products Issuance Reaches CAD 54.98Bn YTD (+5.7% YoY) as Notes Growth Offsets Accelerating GIC Decline
Key Highlights
* Segment Mix: Structured Notes reached CAD 41.91Bn YTD (+23.0% YoY) while GIC volumes fell to CAD 13.07Bn (-27.0% YoY), confirming sustained rotation out of capital-protected deposits.
* Principal at Risk Dominance: PAR Notes account for 65.1% of total YTD volumes and approximately 85.4% of Structured Notes issuance at CAD 35.78Bn YTD (+26.3% YoY), with Principal Protected Notes contributing CAD 6.14Bn (+6.7% YoY).
* Product Mix: Income-oriented structures lead with 43.4% of YTD issuance, followed by capital protected (35.0%) and growth (21.6%), reflecting demand for yield alongside sustained interest in downside protection.
* Structure Mix: Single-underlying structures dominate at 82.0% YTD, with baskets at 17.7% and worst-of structures marginal at 0.3%, indicating continued preference for simplified payoff profiles and targeted exposures.
* Payoff Structures: Barrier Phoenix (41.4%) and Barrier Digital Plus (18.9%) together represent approximately 60.3% of issuance, with Capped Protected Participation (17.4%) and Protected Participation (7.3%) secondary.
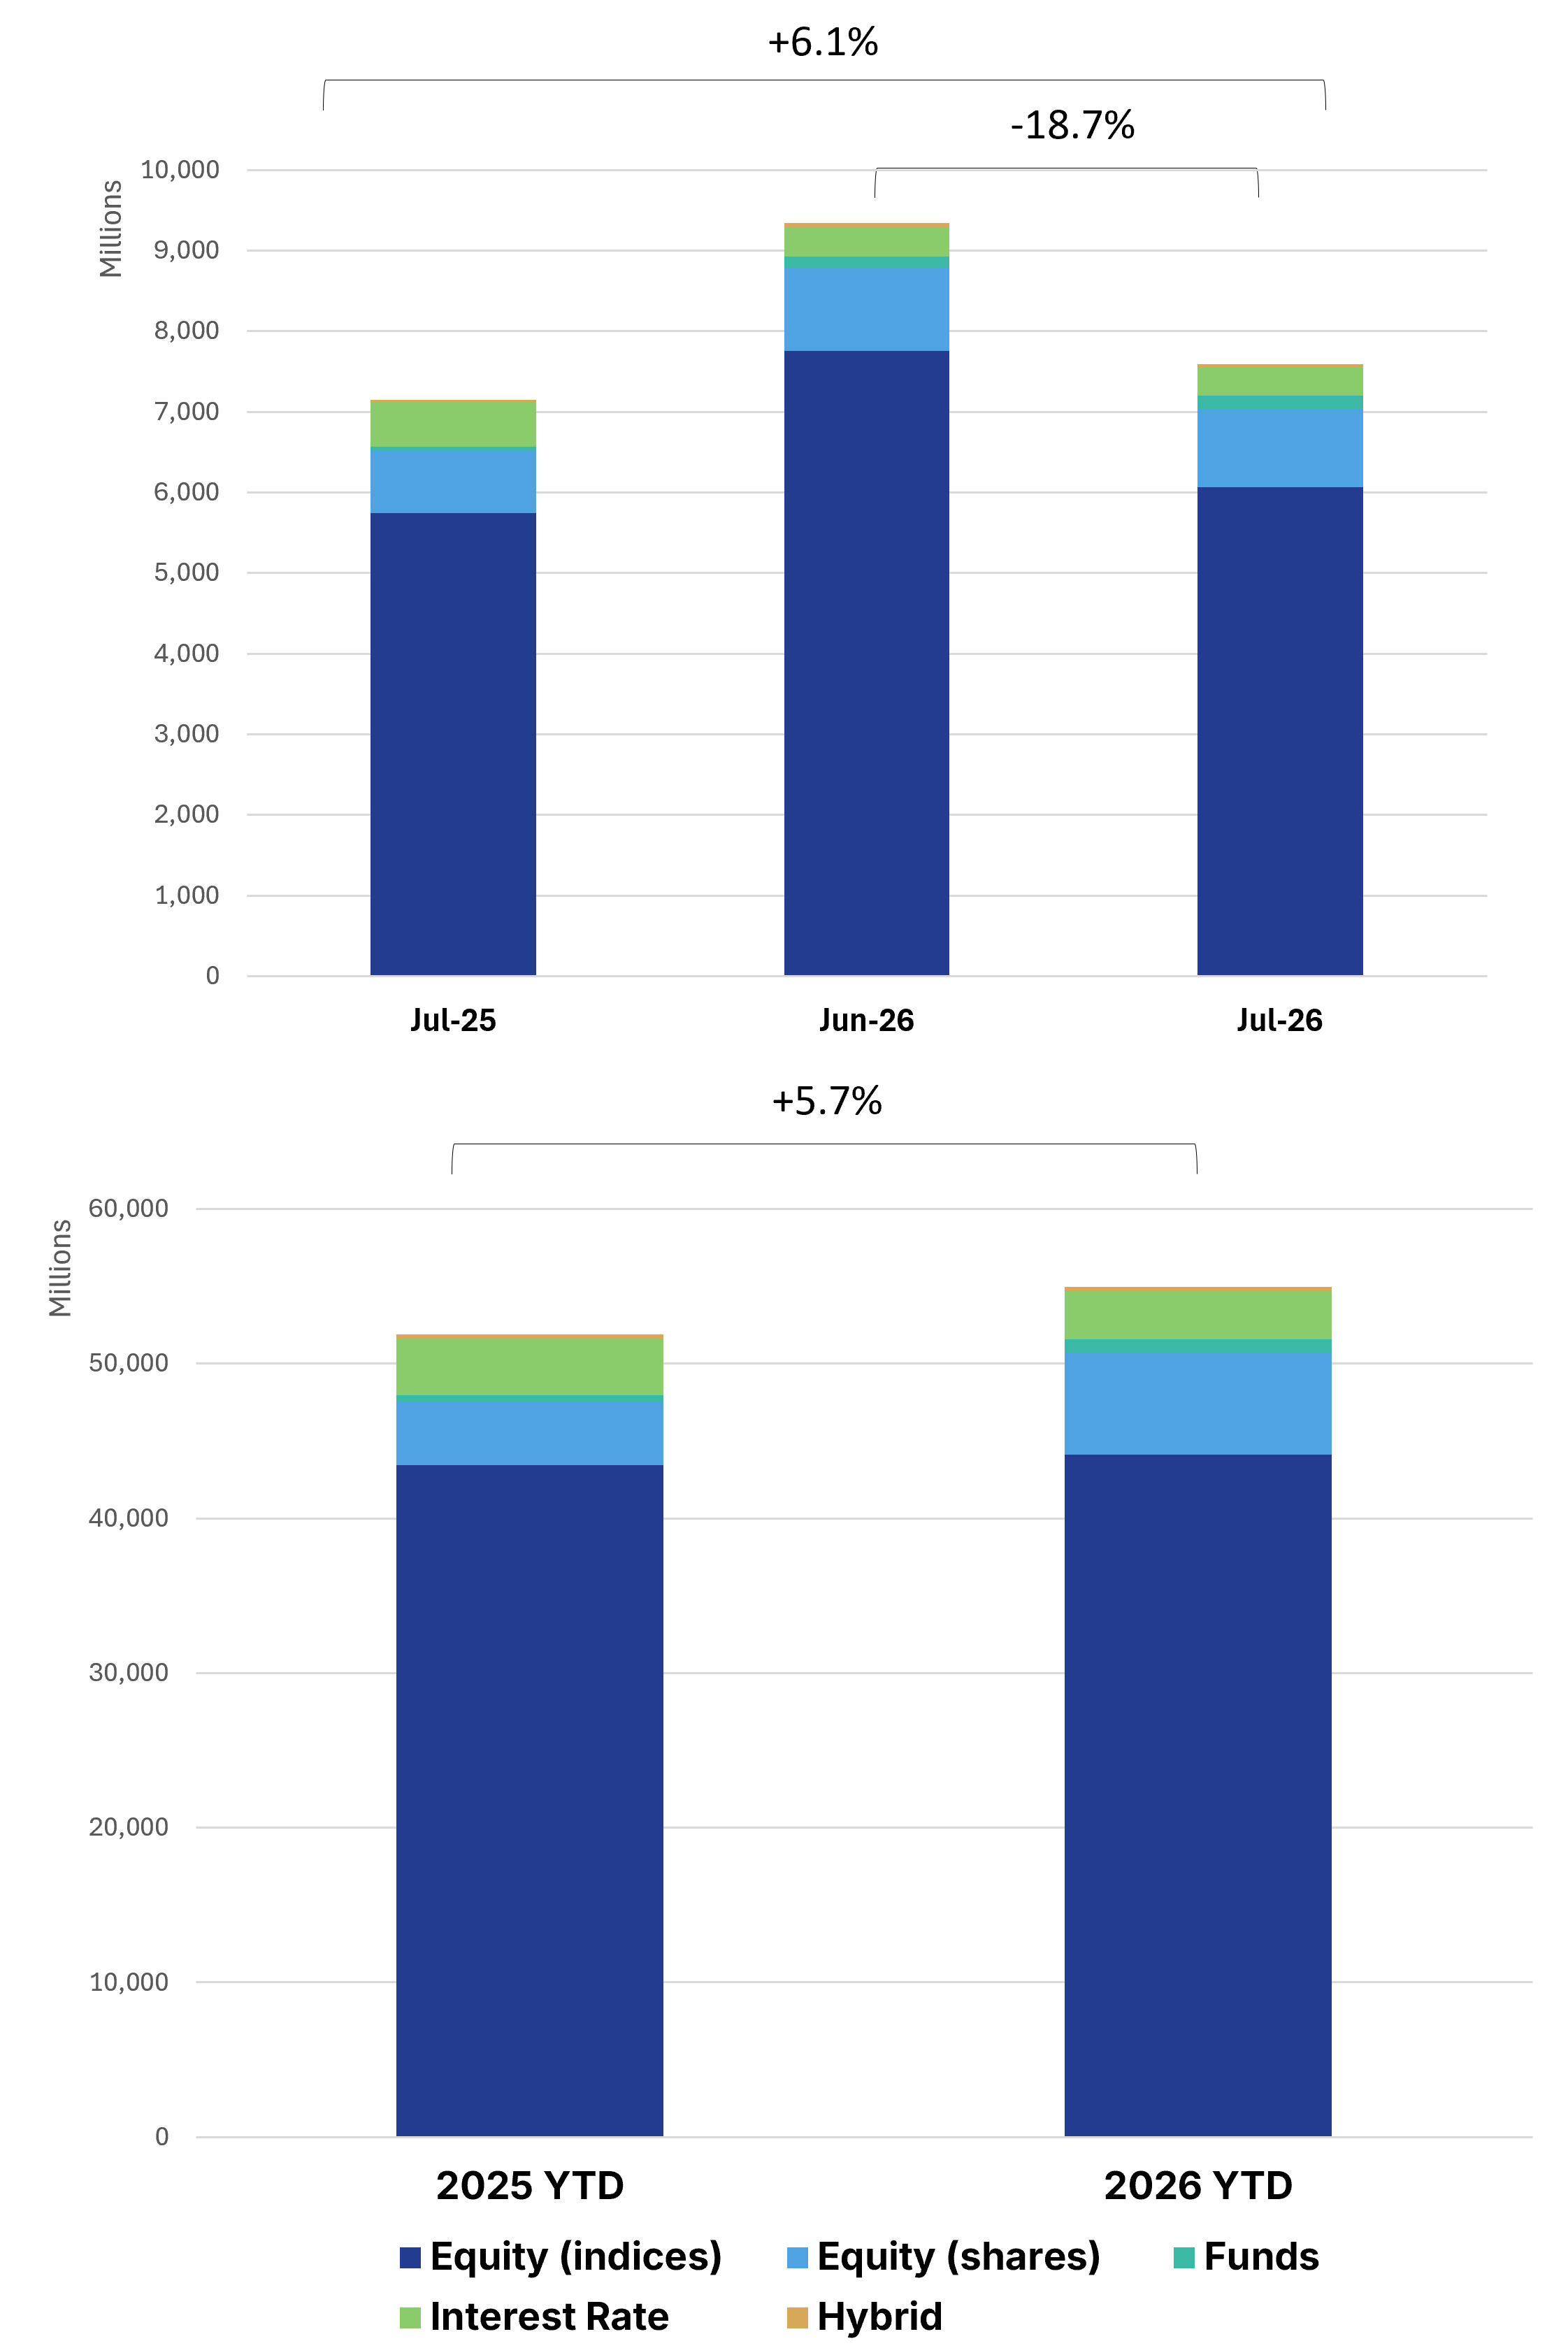
* Asset Allocation: Equity indices account for CAD 44.12Bn YTD, or 80.2% of total issuance, ahead of equity shares at CAD 7.00Bn (12.7%) and interest rates at CAD 3.15Bn (5.7%).
Market Overview
July 2026 confirms the continued reshaping of the Canadian structured products market, with year-to-date volumes reaching CAD 54.98Bn (+5.7% YoY, from CAD 52.02Bn in 2025). Headline growth understates the divergence beneath it: Structured Notes reached CAD 41.91Bn YTD (+23.0% YoY) with CAD 6.58Bn issued in July alone (+20.0% YoY), while GIC volumes declined to CAD 13.07Bn YTD (-27.0% YoY) and fell 39.5% YoY in the month, reflecting continued pressure on capital-protected deposits as Notes issuance accelerated. Within Notes, Principal at Risk formats account for approximately 85.4% of issuance at CAD 35.78Bn YTD (+26.3% YoY), confirming their dominance in the current rate and volatility environment. The product mix remains yield-led, with income structures at 43.4% ahead of capital protected at 35.0% and growth at 21.6%. Structurally the market stays anchored in single-underlying formats (82.0%), with baskets at 17.7% and worst-of exposure marginal at 0.3%, a construction profile that continues to distinguish Canada from the U.S. Payoff activity concentrates in conditional income, led by Barrier Phoenix (41.4%) and Barrier Digital Plus (18.9%) at approximately 60.3% of issuance combined. The market remains heavily equity-driven, with equity indices at 80.2% of total volumes ahead of equity shares (12.7%) and interest rates (5.7%). Overall, July reflects a yield-driven market, combining accelerating Notes issuance, contracting deposit volumes, and sustained concentration in barrier-based income structures.
Methodology & Notes
This report is based on SPi's proprietary database of structured products distributed in Canada. Figures reflect best-effort estimates based on available market data at the time of publication.
Disclaimers
Data Disclaimer (Best Effort / Completeness)
The information presented in this report is based on data collected from a variety of public and proprietary sources. While reasonable care has been taken to ensure accuracy, the data may be incomplete, subject to revisions, or may not capture the entirety of the market. SPi makes no representation or warranty, express or implied, as to the accuracy, completeness, or timeliness of the information.
General Disclaimer
This document is provided for informational purposes only and does not constitute investment advice, an offer, or a recommendation to buy or sell any financial instrument or to adopt any investment strategy. The views expressed are those of SPi at the date of publication and are subject to change without notice. Past performance is not indicative of future results.
SPi accepts no liability for any loss arising from the use of this report or its contents.