
Canadian Market-Linked Investment Volumes Reach CAD 30.77Bn YTD (+22.1% YoY) as Structured Notes Drive Growth
Key Highlights
• Product Mix: Structured Notes dominate total YTD issuance at 73.9%, while GICs account for 26.1%, highlighting sustained investor demand for yield-enhancing and market-linked solutions.
• Structure Mix: Principal at Risk (PAR) Notes lead activity, accounting for 62.0% of total YTD market volumes and 83.8% of Structured Notes YTD volumes.
• Payoff Structures: Income-oriented structures dominate, led by Barrier Phoenix products at 40.6% and Barrier Digital Plus at 19.0%, together representing approximately 59.6% of total issuance.
• Underlying Trends: Issuance remains concentrated in proprietary and portfolio-based indices, led by SOLCD265 Index at 8.4%, Zenitude Aggressive Guaranteed Portfolio at 6.4%, and SOLBEW30 Index at 5.4%.
Market Overview
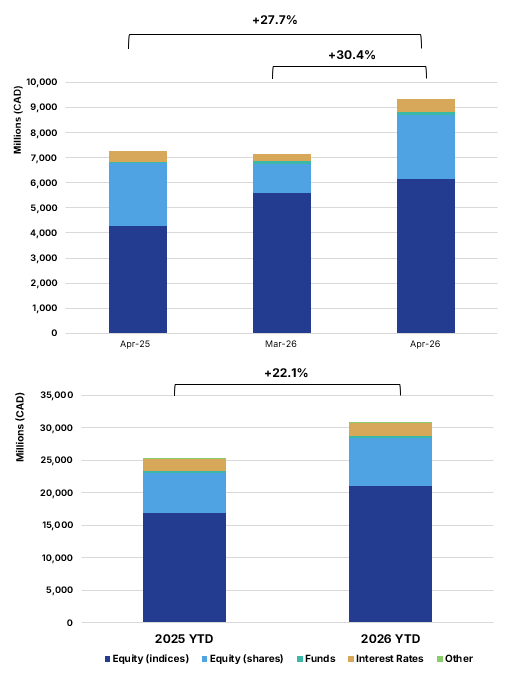
April 2026 confirms continued strength in the Canadian market-linked investments market, with year-to-date volumes reaching CAD 30.77Bn (+22.1% YoY). Market activity remained robust across investment types, although trends continued to diverge between GICs and Structured Notes. GIC volumes increased by 2.4% YoY to CAD 3.26Bn, while Structured Notes issuance rose sharply to CAD 6.06Bn, up 47.3% YoY.
Growth continues to be driven primarily by Structured Notes, which represented 73.9% of total YTD issuance, while GICs accounted for 26.1%. This highlights sustained investor demand for yield-enhancing and market-linked solutions despite continued pressure in capital-protected deposit volumes. Activity was primarily led by Principal at Risk (PAR) Notes, which accounted for 62.0% of total YTD market volumes and 83.8% of Structured Notes YTD volumes, confirming their dominance in the current rate and volatility environment.
Methodology & Notes
This report is based on SPi’s proprietary database of market-linked investments distributed in Canada. Figures reflect best-effort estimates based on available market data at the time of publication.
Disclaimers
Data Disclaimer (Best Effort / Completeness)
The information presented in this report is based on data collected from a variety of public and proprietary sources. While reasonable care has been taken to ensure accuracy, the data may be incomplete, subject to revisions, or may not capture the entirety of the market. SPi makes no representation or warranty, express or implied, as to the accuracy, completeness, or timeliness of the information.
General Disclaimer
This document is provided for informational purposes only and does not constitute investment advice, an offer, or a recommendation to buy or sell any financial instrument or to adopt any investment strategy. The views expressed are those of SPi at the date of publication and are subject to change without notice. Past performance is not indicative of future results.
SPi accepts no liability for any loss arising from the use of this report or its contents.


