
Canada Structured Products Issuance Normalizes Post-Q1 as Strong Notes Growth Offsets Weaker GIC Volumes
Key Highlights
• Product Split: Structured Notes reached CAD 3.6Bn (+32.3% YoY), while GICs declined to CAD 2.4Bn (-24% YoY), driving the normalization in total volumes.
• Seasonality: Post-Q1 slowdown driven primarily by weaker GIC issuance, consistent with bi-monthly patterns observed in prior periods.
• Structure Mix: Single-underlying products dominate at 75.3%, vs. 24.6% for baskets, indicating stable structuring preferences.
• Product Mix: Capital-protected products lead with 49.3%, followed by Income (>33%) and Growth (~17%), maintaining a protection-heavy allocation.
Market Overview
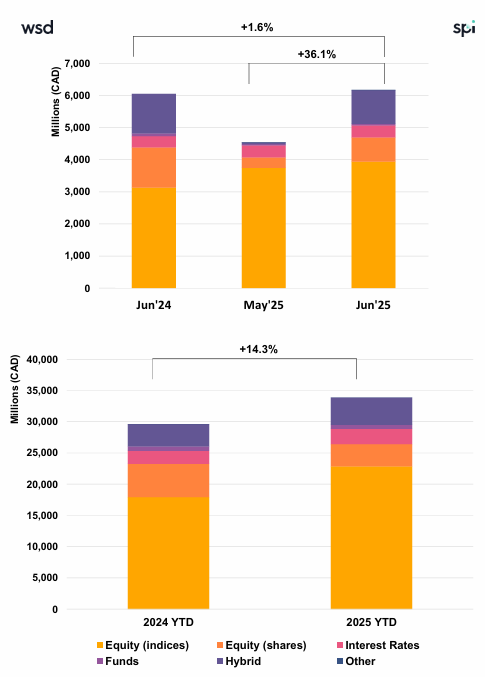
June data reflects a seasonal normalization in Canadian structured product issuance following a strong Q1, primarily driven by a sharp decline in GIC volumes (-24% YoY). Despite this, Structured Notes issuance remains robust (+32.3% YoY), continuing to support overall market activity and confirming the structural shift toward market-linked products. The market retains a strong equity orientation, with equity indices accounting for 67.5% of issuance, while allocations to single stocks and rates remain stable but secondary. Product allocation continues to be dominated by capital-protected structures (49.3%), complemented by a significant share of income strategies, highlighting a balanced approach between protection and yield generation. Structurally, single-underlying products (75.3%) remain the preferred format, reflecting ongoing demand for simplified exposures. The near-equal dominance of Capped Protected Participation (31.5%) and Barrier Phoenix (31.3%), along with strong demand for Barrier Digital Plus (14.2%), underscores a clear investor preference for participation-based payoff structures. Overall, June highlights a healthy but moderating market, where strong note issuance offsets cyclical weakness in GICs, maintaining a stable issuance environment.
Methodology & Notes
This report is based on SPi’s proprietary database of structured products distributed in Canada. Figures reflect best-effort estimates based on available market data at the time of publication.
Disclaimers
Data Disclaimer (Best Effort / Completeness)
The information presented in this report is based on data collected from a variety of public and proprietary sources. While reasonable care has been taken to ensure accuracy, the data may be incomplete, subject to revisions, or may not capture the entirety of the market. SPi makes no representation or warranty, express or implied, as to the accuracy, completeness, or timeliness of the information.
General Disclaimer
This document is provided for informational purposes only and does not constitute investment advice, an offer, or a recommendation to buy or sell any financial instrument or to adopt any investment strategy. The views expressed are those of SPi at the date of publication and are subject to change without notice. Past performance is not indicative of future results.
SPi accepts no liability for any loss arising from the use of this report or its contents.


