
Canada Structured Products Market Accelerates +42.6% YoY as Strong Note Issuance Drives Q1 Momentum
Key Highlights
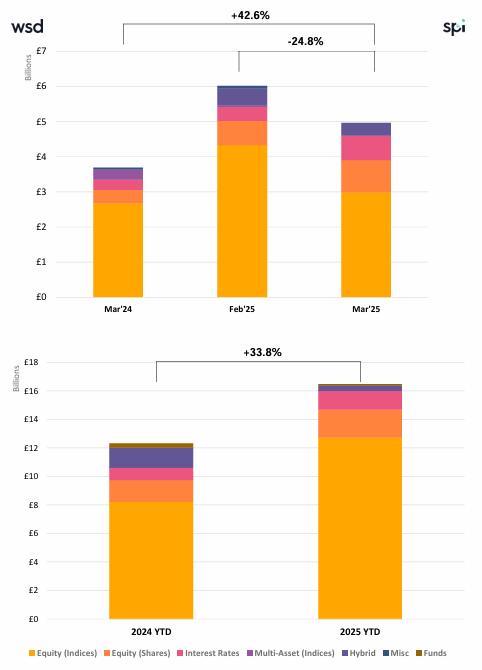
• Product Split: Structured Notes reached CAD 3.63Bn (+8.4% MoM, +58.9% YoY), driving growth, while GICs totaled CAD 1.32Bn (+11.1% YoY).
• YTD Momentum: Q1 volumes surged +33.8% YoY, supported by Structured Notes growth of +53.7%, confirming strong primary activity.
• Structure Mix: Single-underlying products dominate at 77.4% YTD, vs. 22.4% for baskets, reinforcing preference for simpler formats.
• Product Mix: Capital-protected products lead with 48.4% share, down from 55.9% YoY, indicating continued rotation toward higher-risk structures.
• Underlying Trends: Equity indices dominate at 77.2%, increasing further YoY and confirming strong equity-driven issuance.
• Payoff Preferences: Barrier Phoenix leads (31.7%), followed closely by Capped Protected Participation (31.1%), despite a sharp -67.1% MoM decline in the latter.
Market Overview
March marks a significant acceleration in Canadian structured product issuance, with +42.6% YoY growth, bringing Q1 volumes to +33.8% YoY and confirming strong market momentum. This expansion is largely driven by robust Structured Notes issuance (+58.9% YoY), which continues to outpace GICs and reflects a structural shift toward market-linked solutions. The market remains highly equity-centric, with equity indices capturing 77.2% of issuance, reinforcing investor confidence in equity markets. At the same time, the decline in capital-protected product share (48.4% vs. 55.9% YoY) highlights a gradual increase in risk appetite, as investors seek enhanced returns. Structurally, single-underlying products (77.4%) continue to dominate, underscoring the Canadian market’s preference for simplicity. The re-emergence of Barrier Phoenix structures (31.7%) as the leading payoff, alongside still-elevated Capped Protected Participation (31.1%), indicates a balanced demand between yield enhancement and capital preservation. Overall, March confirms a strong Q1 finish, characterized by accelerating issuance, rising equity exposure, and a measured shift toward higher-yield structures.
Methodology & Notes
This report is based on SPi’s proprietary database of structured products distributed in Canada. Figures reflect best-effort estimates based on available market data at the time of publication.
Disclaimers
Data Disclaimer (Best Effort / Completeness)
The information presented in this report is based on data collected from a variety of public and proprietary sources. While reasonable care has been taken to ensure accuracy, the data may be incomplete, subject to revisions, or may not capture the entirety of the market. SPi makes no representation or warranty, express or implied, as to the accuracy, completeness, or timeliness of the information.
General Disclaimer
This document is provided for informational purposes only and does not constitute investment advice, an offer, or a recommendation to buy or sell any financial instrument or to adopt any investment strategy. The views expressed are those of SPi at the date of publication and are subject to change without notice. Past performance is not indicative of future results.
SPi accepts no liability for any loss arising from the use of this report or its contents.


