
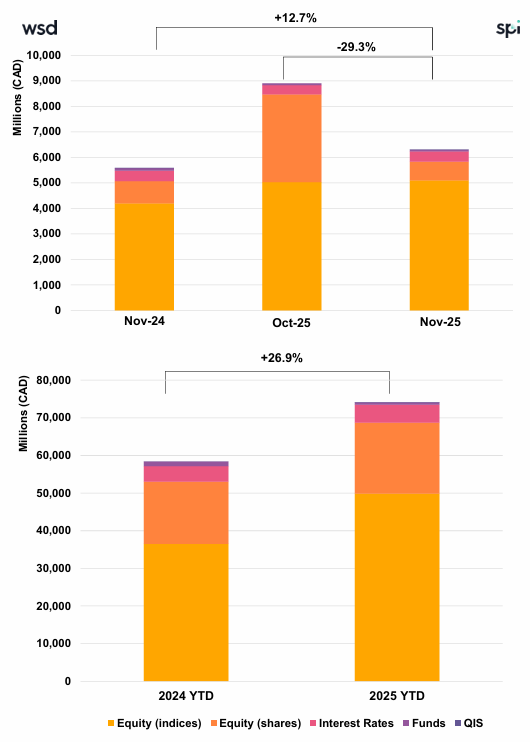
Canada Structured Products Issuance Reaches CAD 74.2Bn (+26.9% YoY) as November Hits CAD 6.2Bn, Slightly Above Forecast
Key Highlights
• Product Split: Structured Notes reached a record CAD 5.2Bn (+40.4% YoY), while GICs declined to CAD 1.1Bn (-15.7% YoY), reinforcing divergence across segments.
• YTD Momentum: Volumes reached CAD 74.2Bn (+26.9% YoY), keeping the market on track to exceed CAD 80Bn in 2025 (~+22.5% YoY).
• Structure Mix: Single-underlying products dominate at 74.9%, vs. 24.9% for baskets, indicating stable structuring trends.
• Product Mix: Capital-protected products lead with 47%, followed by Income (35.4%) and Growth (~17.6%), maintaining balanced allocation.
Market Overview
November data highlights a continued strong expansion in the Canadian structured products market, with year-to-date issuance reaching CAD 74.2Bn (+26.9% YoY) and monthly volumes (CAD 6.2Bn) slightly exceeding expectations. The market remains firmly driven by Structured Notes, which reached a record CAD 5.2Bn (+40.4% YoY), while GIC volumes declined (-15.7% YoY), reinforcing the ongoing shift toward market-linked solutions. Product allocation remains well-balanced, with capital-protected products (47%) leading, alongside meaningful contributions from income and growth segments. The market continues to exhibit a strong equity bias, with equity index-linked products (67.2%) gaining share, while single-stock exposure declines, indicating a rotation toward broader market exposure. Structurally, single-underlying products (74.9%) remain dominant, reflecting consistent investor preferences. Payoff structures continue to be anchored by Barrier Phoenix and Capped Protected Participation, reinforcing the dominance of participation-based strategies. A notable development is the sharp decline in issuance linked to historically dominant indices, suggesting shifting structuring trends and underlying preferences. Overall, November confirms a resilient and mature growth phase, with strong note issuance, evolving underlying selection, and sustained demand heading into year-end.
Methodology & Notes
This report is based on SPi’s proprietary database of structured products distributed in Canada. Figures reflect best-effort estimates based on available market data at the time of publication.
Disclaimers
Data Disclaimer (Best Effort / Completeness)
The information presented in this report is based on data collected from a variety of public and proprietary sources. While reasonable care has been taken to ensure accuracy, the data may be incomplete, subject to revisions, or may not capture the entirety of the market. SPi makes no representation or warranty, express or implied, as to the accuracy, completeness, or timeliness of the information.
General Disclaimer
This document is provided for informational purposes only and does not constitute investment advice, an offer, or a recommendation to buy or sell any financial instrument or to adopt any investment strategy. The views expressed are those of SPi at the date of publication and are subject to change without notice. Past performance is not indicative of future results.
SPi accepts no liability for any loss arising from the use of this report or its contents.


