
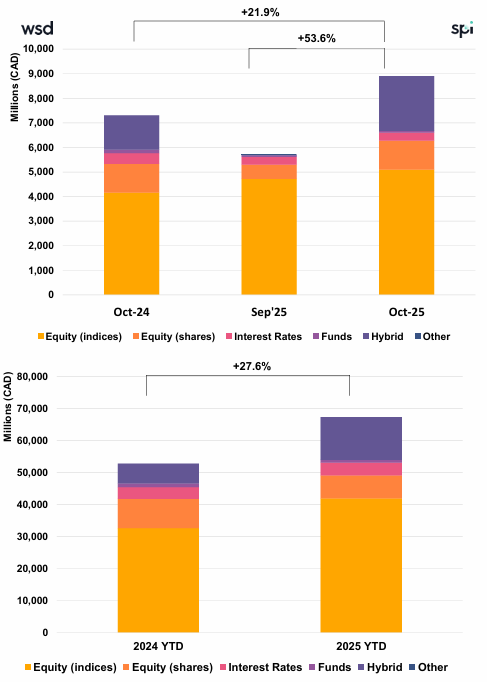
Canada Structured Products Issuance Reaches CAD 67.3Bn (+27.6% YoY) as October Prints CAD 8.9Bn, Slightly Above Forecast
Key Highlights
• Product Split: Structured Notes totaled CAD 4.9Bn (+37% YoY), representing 55% of issuance, while GICs reached CAD 3.9Bn (+28% YoY), supported by strong distribution activity.
• YTD Momentum: Volumes reached CAD 67.3Bn (+27.6% YoY), slightly exceeding forecast expectations (+0.9% vs. upper bound).
• Structure Mix: Single-underlying products declined to 73.5%, vs. 26.2% for baskets, reflecting increased diversification driven by GIC flows.
• Product Mix: Capital-protected products lead with 48.3%, followed by Income (34.7%) and Growth (~17.0%); both income (CAD 2.82Bn) and growth (CAD 1.44Bn) reached new monthly highs.
Market Overview
October data highlights a continued strong expansion in the Canadian structured products market, with issuance reaching CAD 8.9Bn, slightly exceeding expectations, and bringing year-to-date volumes to CAD 67.3Bn (+27.6% YoY). Growth remains broad-based across both Notes and GICs, with Structured Notes (+37% YoY) maintaining their central role while GICs (+28% YoY) contributed meaningfully this month. The market continues to exhibit a balanced product allocation, with capital-protected products (48.3%) leading, while income and growth segments both reached record monthly levels, signaling strong demand across risk profiles. Structurally, the decline in single-underlying share (73.5%) and corresponding increase in baskets (26.2%) suggest a gradual shift toward more diversified exposures, partly driven by GIC structuring. The market remains equity-centric, with equity indices (62.3%) dominating, although the rise in hybrid products (19.0%) points to increasing product sophistication. The continued dominance of Barrier Phoenix and Capped Protected Participation (~32% each) reinforces the central role of participation-based payoff structures. Overall, October confirms a resilient and expanding market, with strong issuance, diversified growth drivers, and sustained investor demand heading into year-end.
Methodology & Notes
This report is based on SPi’s proprietary database of structured products distributed in Canada. Figures reflect best-effort estimates based on available market data at the time of publication.
Disclaimers
Data Disclaimer (Best Effort / Completeness)
The information presented in this report is based on data collected from a variety of public and proprietary sources. While reasonable care has been taken to ensure accuracy, the data may be incomplete, subject to revisions, or may not capture the entirety of the market. SPi makes no representation or warranty, express or implied, as to the accuracy, completeness, or timeliness of the information.
General Disclaimer
This document is provided for informational purposes only and does not constitute investment advice, an offer, or a recommendation to buy or sell any financial instrument or to adopt any investment strategy. The views expressed are those of SPi at the date of publication and are subject to change without notice. Past performance is not indicative of future results.
SPi accepts no liability for any loss arising from the use of this report or its contents.


