
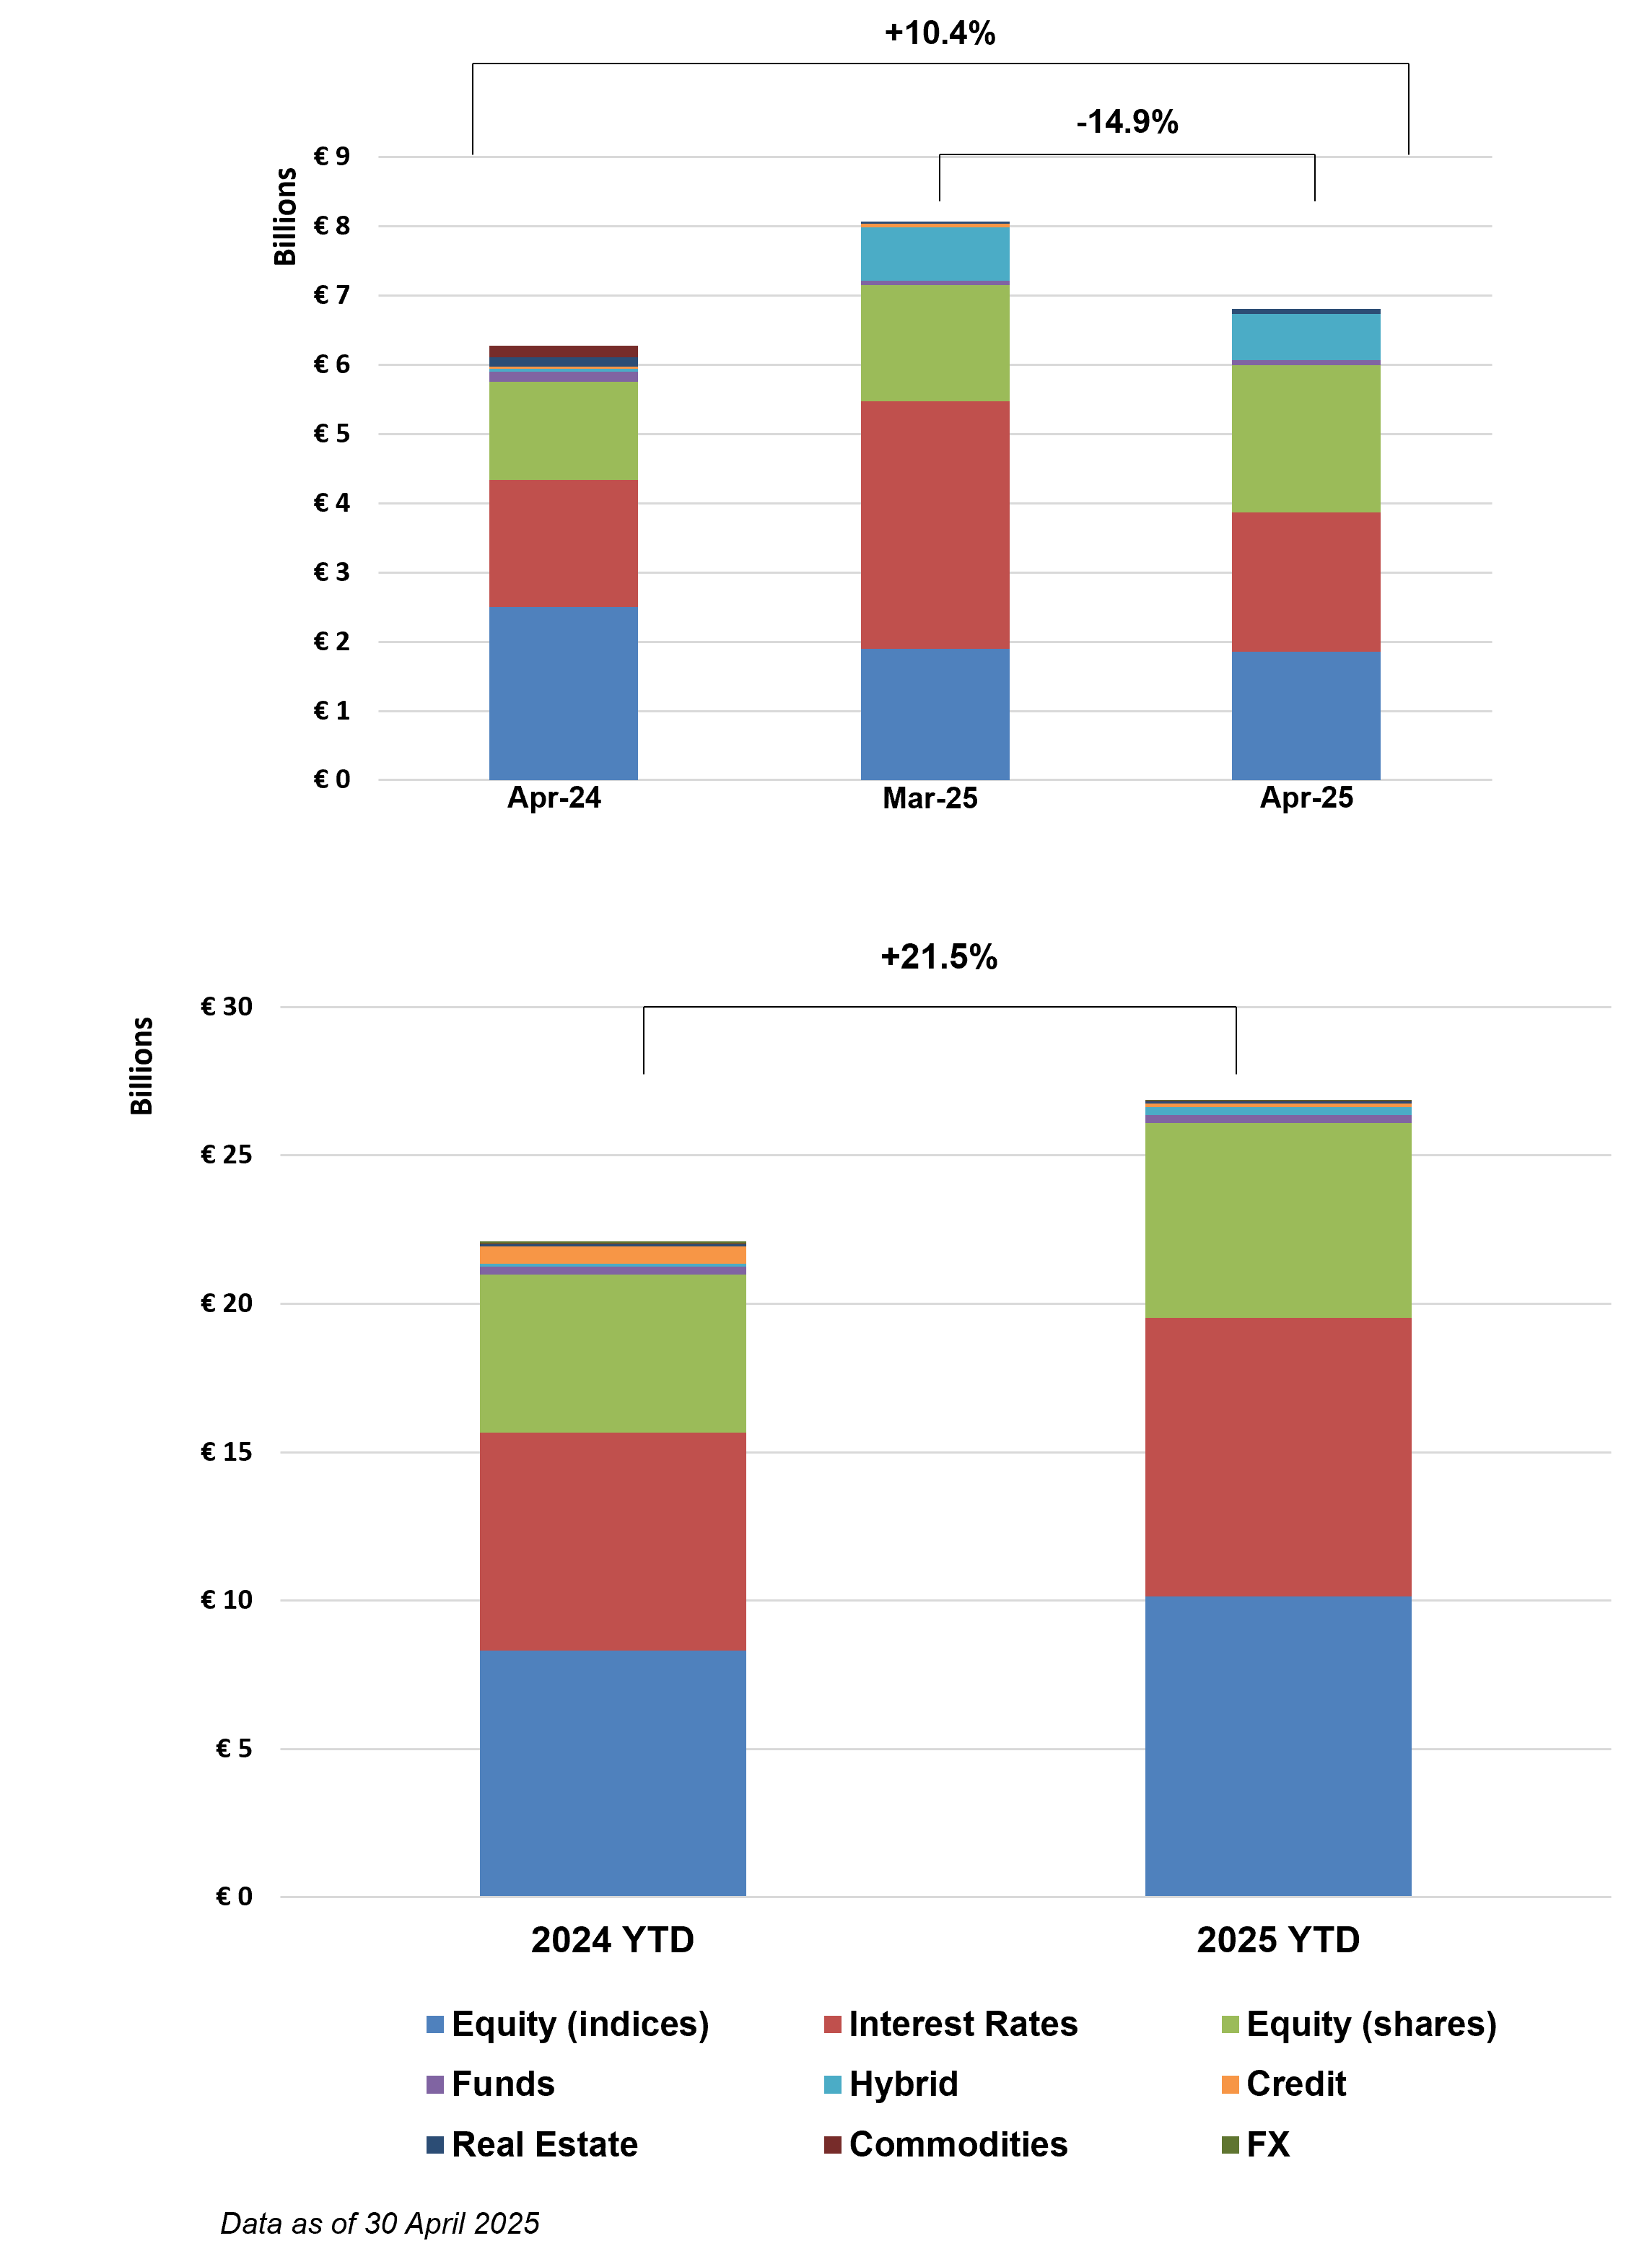
France Structured Products Issuance Reaches EUR 26.9Bn (+21.5% YoY) as Monthly Volumes Hit EUR 6.93Bn (+10.4% YoY)
Key Highlights
• Issuance Dynamics: Year-to-date volumes reached EUR 26.9Bn (+21.5% YoY); April issuance totalled EUR 6.93Bn (+10.4% YoY) (excluding CACIB volumes).
• Structure Mix: Single-underlying products dominate at 85.8%, though declining; worst-of increased to 10.8%, while baskets remain marginal (3.3%).
• Product Mix: Growth products lead (36.4%), followed by Income (32%), which now surpass Capital Protected (31.6%), indicating a shift toward yield strategies.
• Underlying Trends: Equity indices lead with ~38%, followed by rates (34.9%) and single stocks (24.5%), confirming balanced cross-asset allocation.
• Payoff Structures: Complex products dominate (32.8%), followed by barrier digital (25.1%) and barrier phoenix (18.1%), the latter gaining traction.
Market Overview
April data confirms the continued expansion of the French structured products market, with year-to-date issuance reaching EUR 26.9Bn (+21.5% YoY), supported by steady monthly activity (EUR 6.93Bn, +10.4% YoY). While single-underlying structures remain dominant (85.8%), the gradual rise in worst-of exposure (10.8%) signals a shift toward more diversified and yield-enhancing structures. Product allocation reflects a notable transition, with income products (32%) overtaking capital-protected structures (31.6%), highlighting increasing demand for yield in the current environment. The market maintains a balanced asset allocation, with equity indices (~38%) and interest rates (34.9%) both playing key roles, indicating a dual strategy combining equity exposure and rates-driven income. Structurally, the dominance of complex and barrier-based payoffs (~76% combined) underscores a preference for engineered return profiles, with barrier phoenix structures gaining traction. Overall, April reflects a maturing growth phase, characterized by solid issuance levels, evolving structure mix, and increasing appetite for income-oriented strategies.
Methodology & Notes
This report is based on SPi’s proprietary database of structured products distributed in France. Figures reflect best-effort estimates based on available market data at the time of publication.
Disclaimers
Data Disclaimer (Best Effort / Completeness)
The information presented in this report is based on data collected from a variety of public and proprietary sources. While reasonable care has been taken to ensure accuracy, the data may be incomplete, subject to revisions, or may not capture the entirety of the market. SPi makes no representation or warranty, express or implied, as to the accuracy, completeness, or timeliness of the information.
General Disclaimer
This document is provided for informational purposes only and does not constitute investment advice, an offer, or a recommendation to buy or sell any financial instrument or to adopt any investment strategy. The views expressed are those of SPi at the date of publication and are subject to change without notice. Past performance is not indicative of future results.
SPi accepts no liability for any loss arising from the use of this report or its contents.


