
France Structured Products Issuance Reaches EUR 12.1Bn YTD as Growth Products Rebound to 35.7% Share
Key Highlights
• Product Mix: Growth (35.7%) leads, closely followed by Capital Protected (35.3%), while Income declines to 29.0%, confirming a shift toward risk-on positioning.
• Payoff Structures: Barrier Digital (26.0%) dominates, followed by Complex (22.3%) and Barrier Phoenix (21.9%), with rising demand for customized structures.
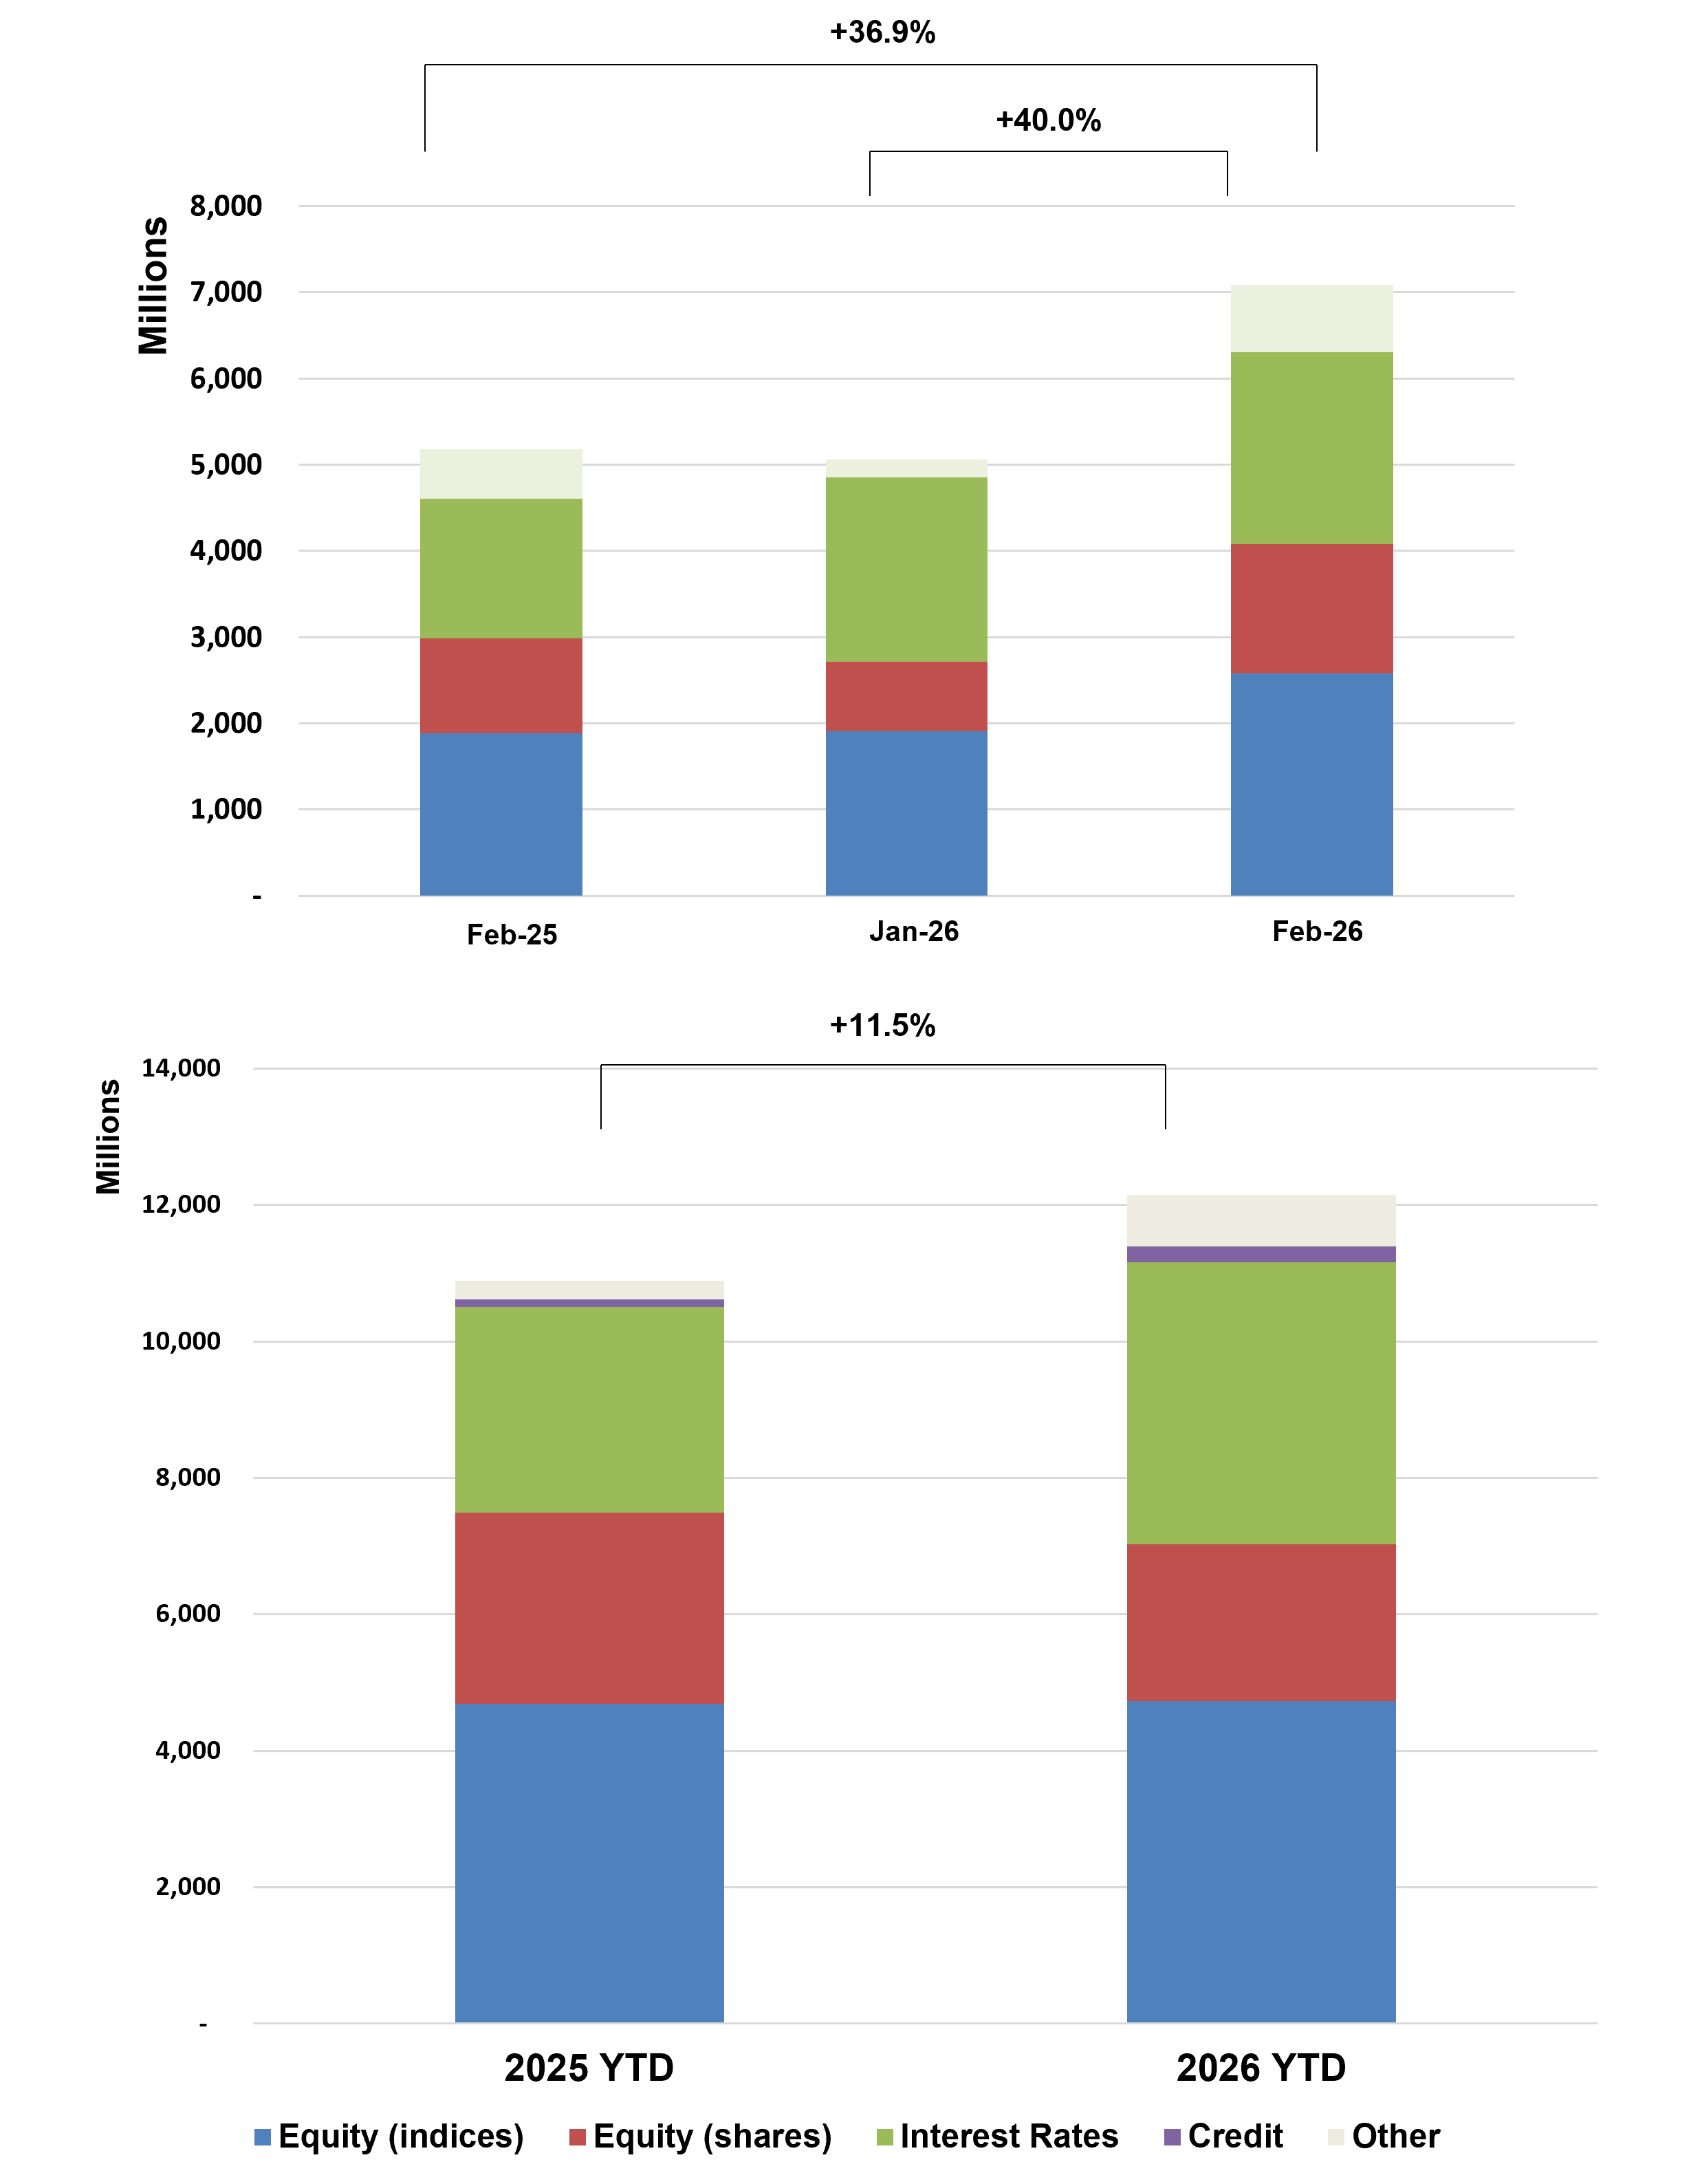
• Underlying Trends: Equity indices (36.9%) slightly lead Interest Rates (34.0%); single stocks rebound to 18.9%, indicating selective return to idiosyncratic exposure.
• Structure Mix: Single-underlying products remain dominant at 89.2%, while worst-of increases to 8.4% and baskets remain marginal (2.4%).
Market Overview
February 2026 confirms a strong start to the year, with year-to-date issuance reaching EUR 12.1Bn and a clear rotation toward growth-oriented structures. The rebound in Growth products (35.7% YTD; 41.5% monthly) signals a renewed risk-on sentiment, partially reversing the defensive positioning observed in January. At the same time, Capital Protected products (35.3%) remain elevated, highlighting a barbell allocation between protection and upside participation. On the asset side, equity indices (36.9%) and interest rates (34.0%) continue to dominate, while the recovery in single-stock exposure (18.9%) suggests a gradual re-engagement with idiosyncratic risk. Structurally, barrier-based payoffs remain the backbone of issuance, with Barrier Digital (26.0%) and Barrier Phoenix (21.9%) sustaining strong demand for yield-enhancing strategies. The increase in complex structures (22.3%) further indicates a shift toward bespoke and rates-driven solutions. Overall, February reflects a transition toward more growth-driven positioning, while maintaining strong demand for structured yield and diversification across payoff types.
Methodology & Notes
This report is based on SPi’s proprietary database of structured products distributed in France. Figures reflect best-effort estimates based on available market data at the time of publication.
Disclaimers
Data Disclaimer (Best Effort / Completeness)
The information presented in this report is based on data collected from a variety of public and proprietary sources. While reasonable care has been taken to ensure accuracy, the data may be incomplete, subject to revisions, or may not capture the entirety of the market. SPi makes no representation or warranty, express or implied, as to the accuracy, completeness, or timeliness of the information.
General Disclaimer
This document is provided for informational purposes only and does not constitute investment advice, an offer, or a recommendation to buy or sell any financial instrument or to adopt any investment strategy. The views expressed are those of SPi at the date of publication and are subject to change without notice. Past performance is not indicative of future results.
SPi accepts no liability for any loss arising from the use of this report or its contents.


