
France Structured Products Issuance Reaches EUR 50.08Bn YTD as August Volumes Decline to EUR 3.5Bn (-26% YoY) on Seasonal Weakness
Key Highlights
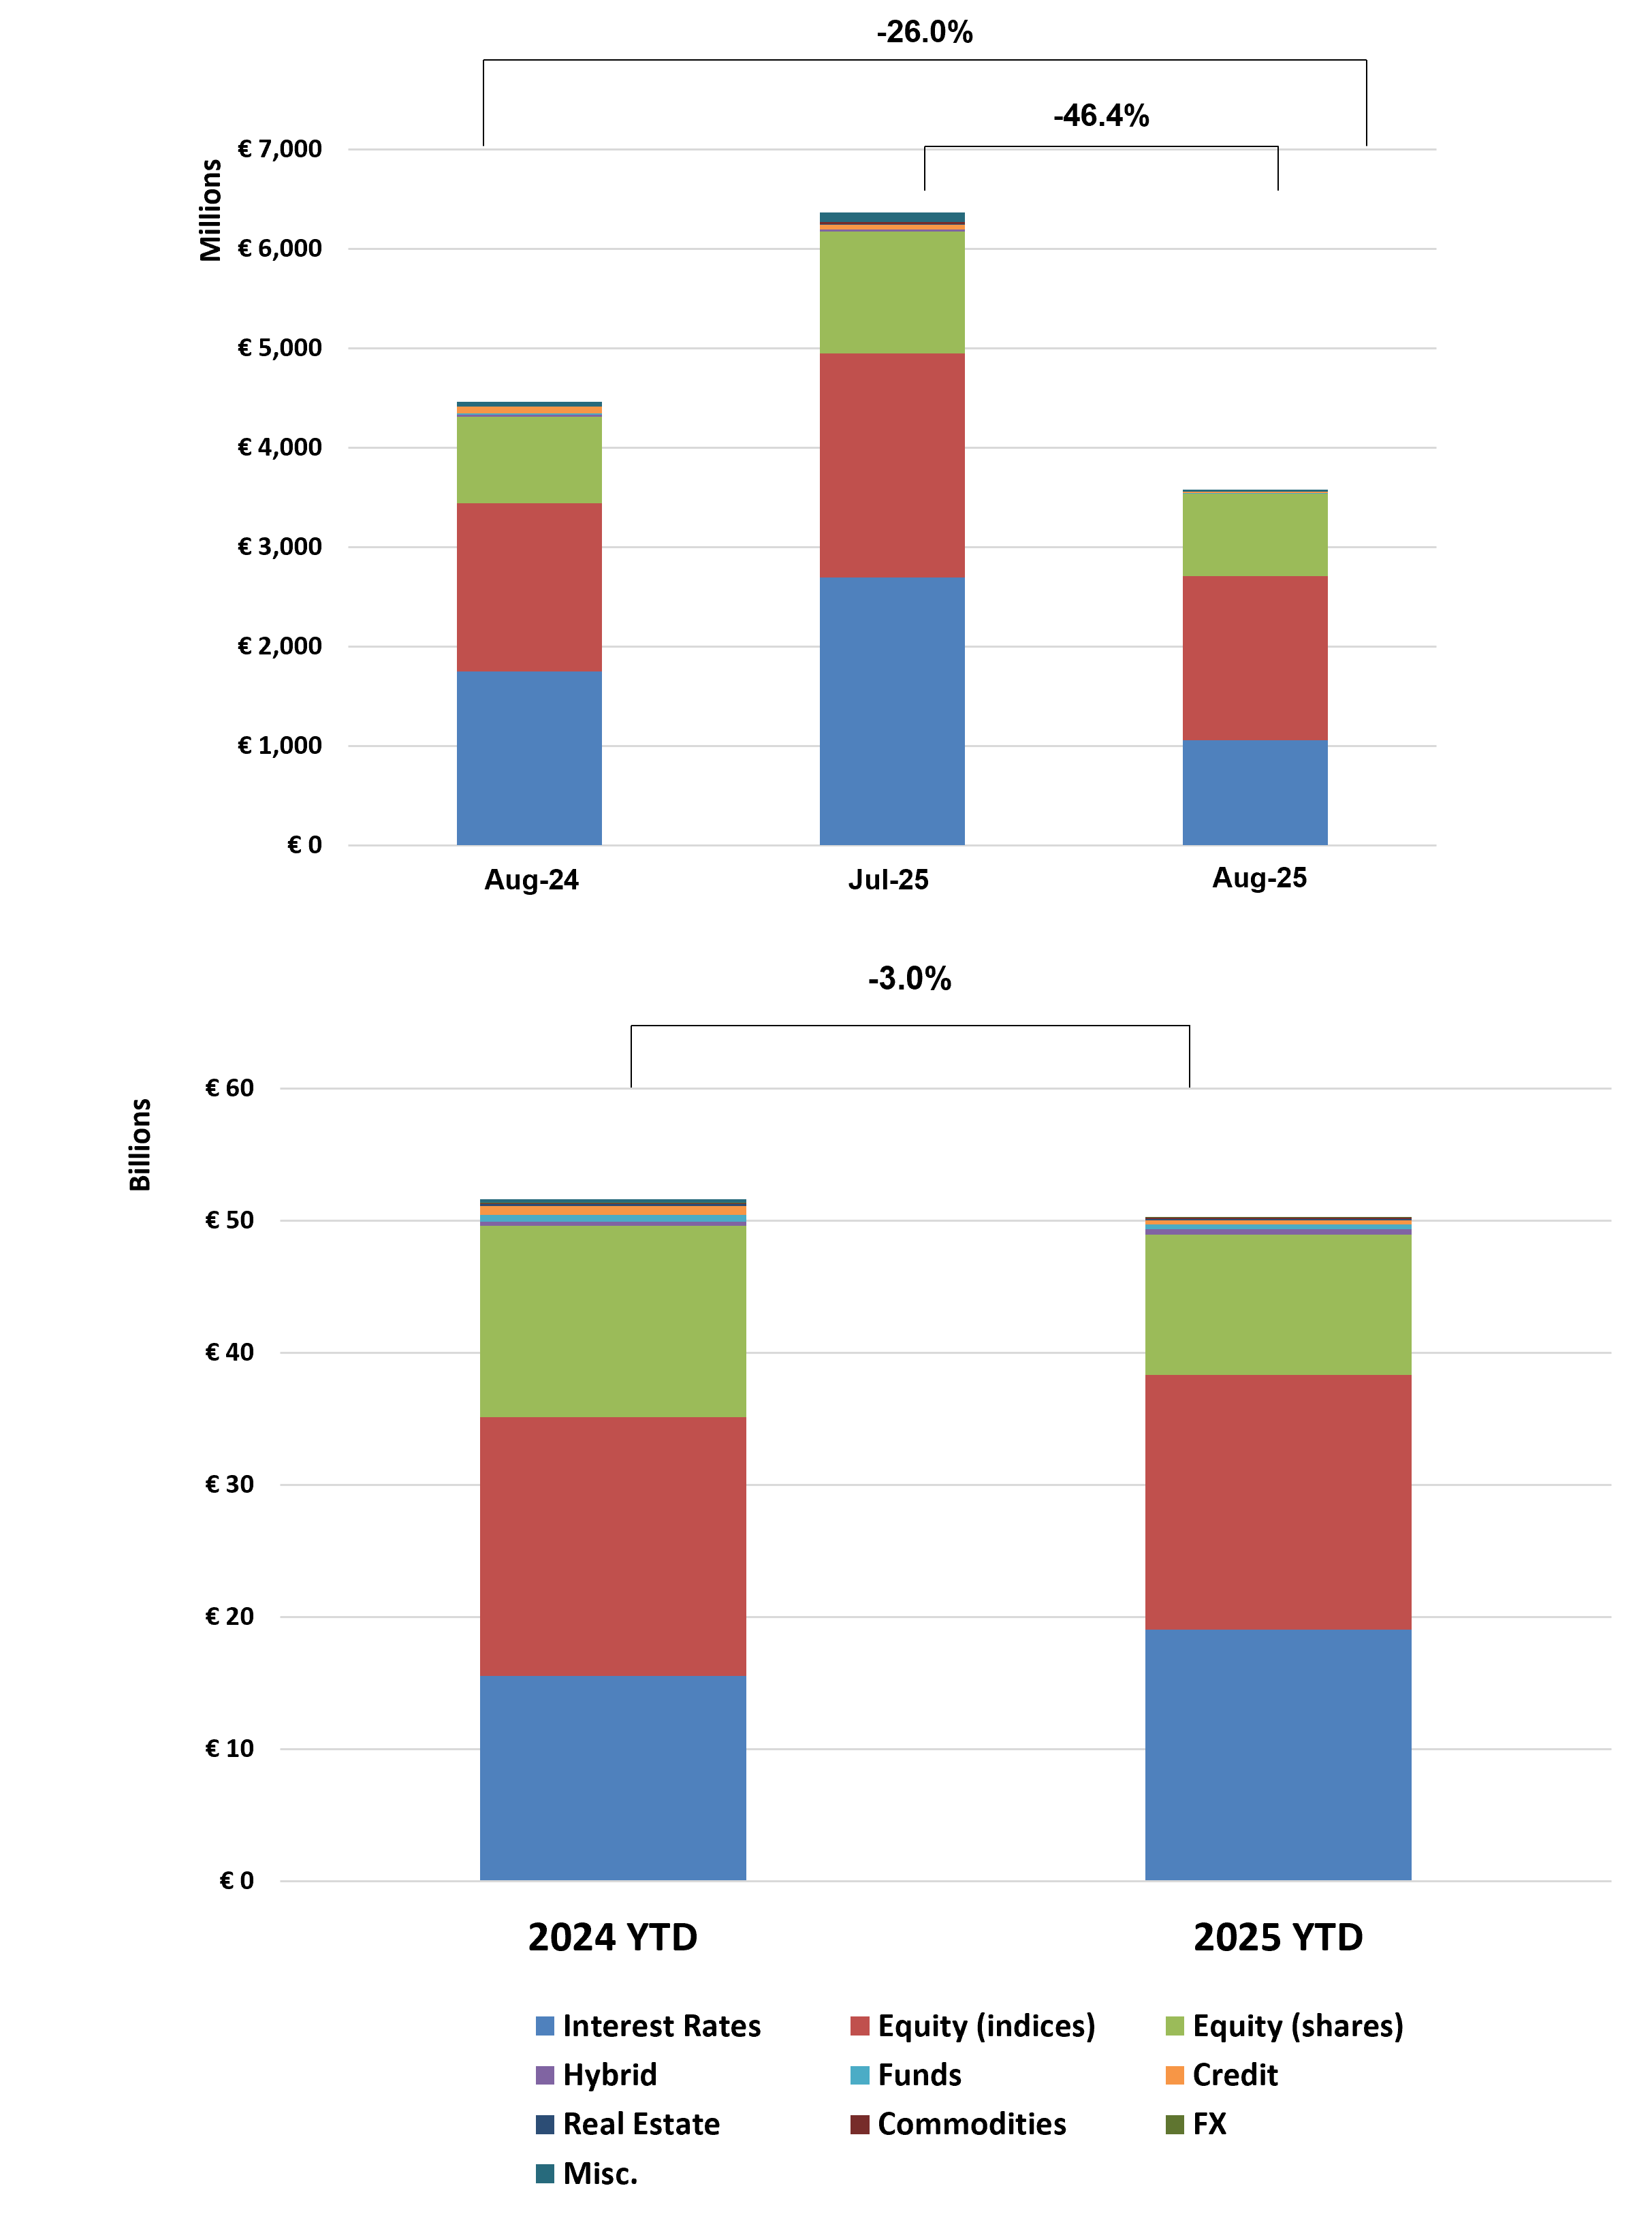
• Issuance Dynamics: Year-to-date volumes reached EUR 50.08Bn; August issuance slowed to EUR 3.5Bn (-26% YoY), reflecting seasonal effects.
• Structure Mix: Single-underlying products dominate at 88.1%, while worst-of (8.8%) and baskets (3.1%) remain marginal.
• Product Mix: Growth products lead (32.4%), followed by Capital Protected (32.0%) and Income (30.8%), maintaining balanced allocation.
• Underlying Trends: Equity indices lead at 38.4%, slightly ahead of rates (38.0%); single stocks (21.2%) remain secondary.
• Payoff Structures: Complex products declined to 33.8%, followed by barrier digital (25.5%) and barrier phoenix (17.6%), indicating slight softening in structured payoff demand.
Market Overview
August data reflects a seasonal slowdown in the French structured products market, with issuance declining to EUR 3.5Bn (-26% YoY), while year-to-date volumes remain solid at EUR 50.08Bn. The market continues to be heavily concentrated in single-underlying structures (88.1%), reinforcing its simplicity-driven profile. Product allocation remains well-balanced, with growth (32.4%), capital-protected (32.0%), and income (30.8%) products each capturing similar shares, highlighting diversified investor demand. A notable shift occurred in the underlying mix, with equity indices (38.4%) slightly overtaking interest rate-linked products (38.0%), signalling a modest rotation back toward equity exposure. Structurally, the decline in complex and barrier-based payoffs suggests a temporary easing in demand for more engineered structures, likely influenced by lower summer activity. Overall, August represents a seasonally weaker but structurally stable period, with solid YTD growth, balanced product allocation, and minor adjustments in underlying and payoff preferences.
Methodology & Notes
This report is based on SPi’s proprietary database of structured products distributed in France. Figures reflect best-effort estimates based on available market data at the time of publication.
Disclaimers
Data Disclaimer (Best Effort / Completeness)
The information presented in this report is based on data collected from a variety of public and proprietary sources. While reasonable care has been taken to ensure accuracy, the data may be incomplete, subject to revisions, or may not capture the entirety of the market. SPi makes no representation or warranty, express or implied, as to the accuracy, completeness, or timeliness of the information.
General Disclaimer
This document is provided for informational purposes only and does not constitute investment advice, an offer, or a recommendation to buy or sell any financial instrument or to adopt any investment strategy. The views expressed are those of SPi at the date of publication and are subject to change without notice. Past performance is not indicative of future results.
SPi accepts no liability for any loss arising from the use of this report or its contents.


