
France Structured Products Issuance Reaches EUR 40.8Bn (+8.7% YoY) Despite Continued Monthly Softness at EUR 6.2Bn (-2.3% YoY)
Key Highlights
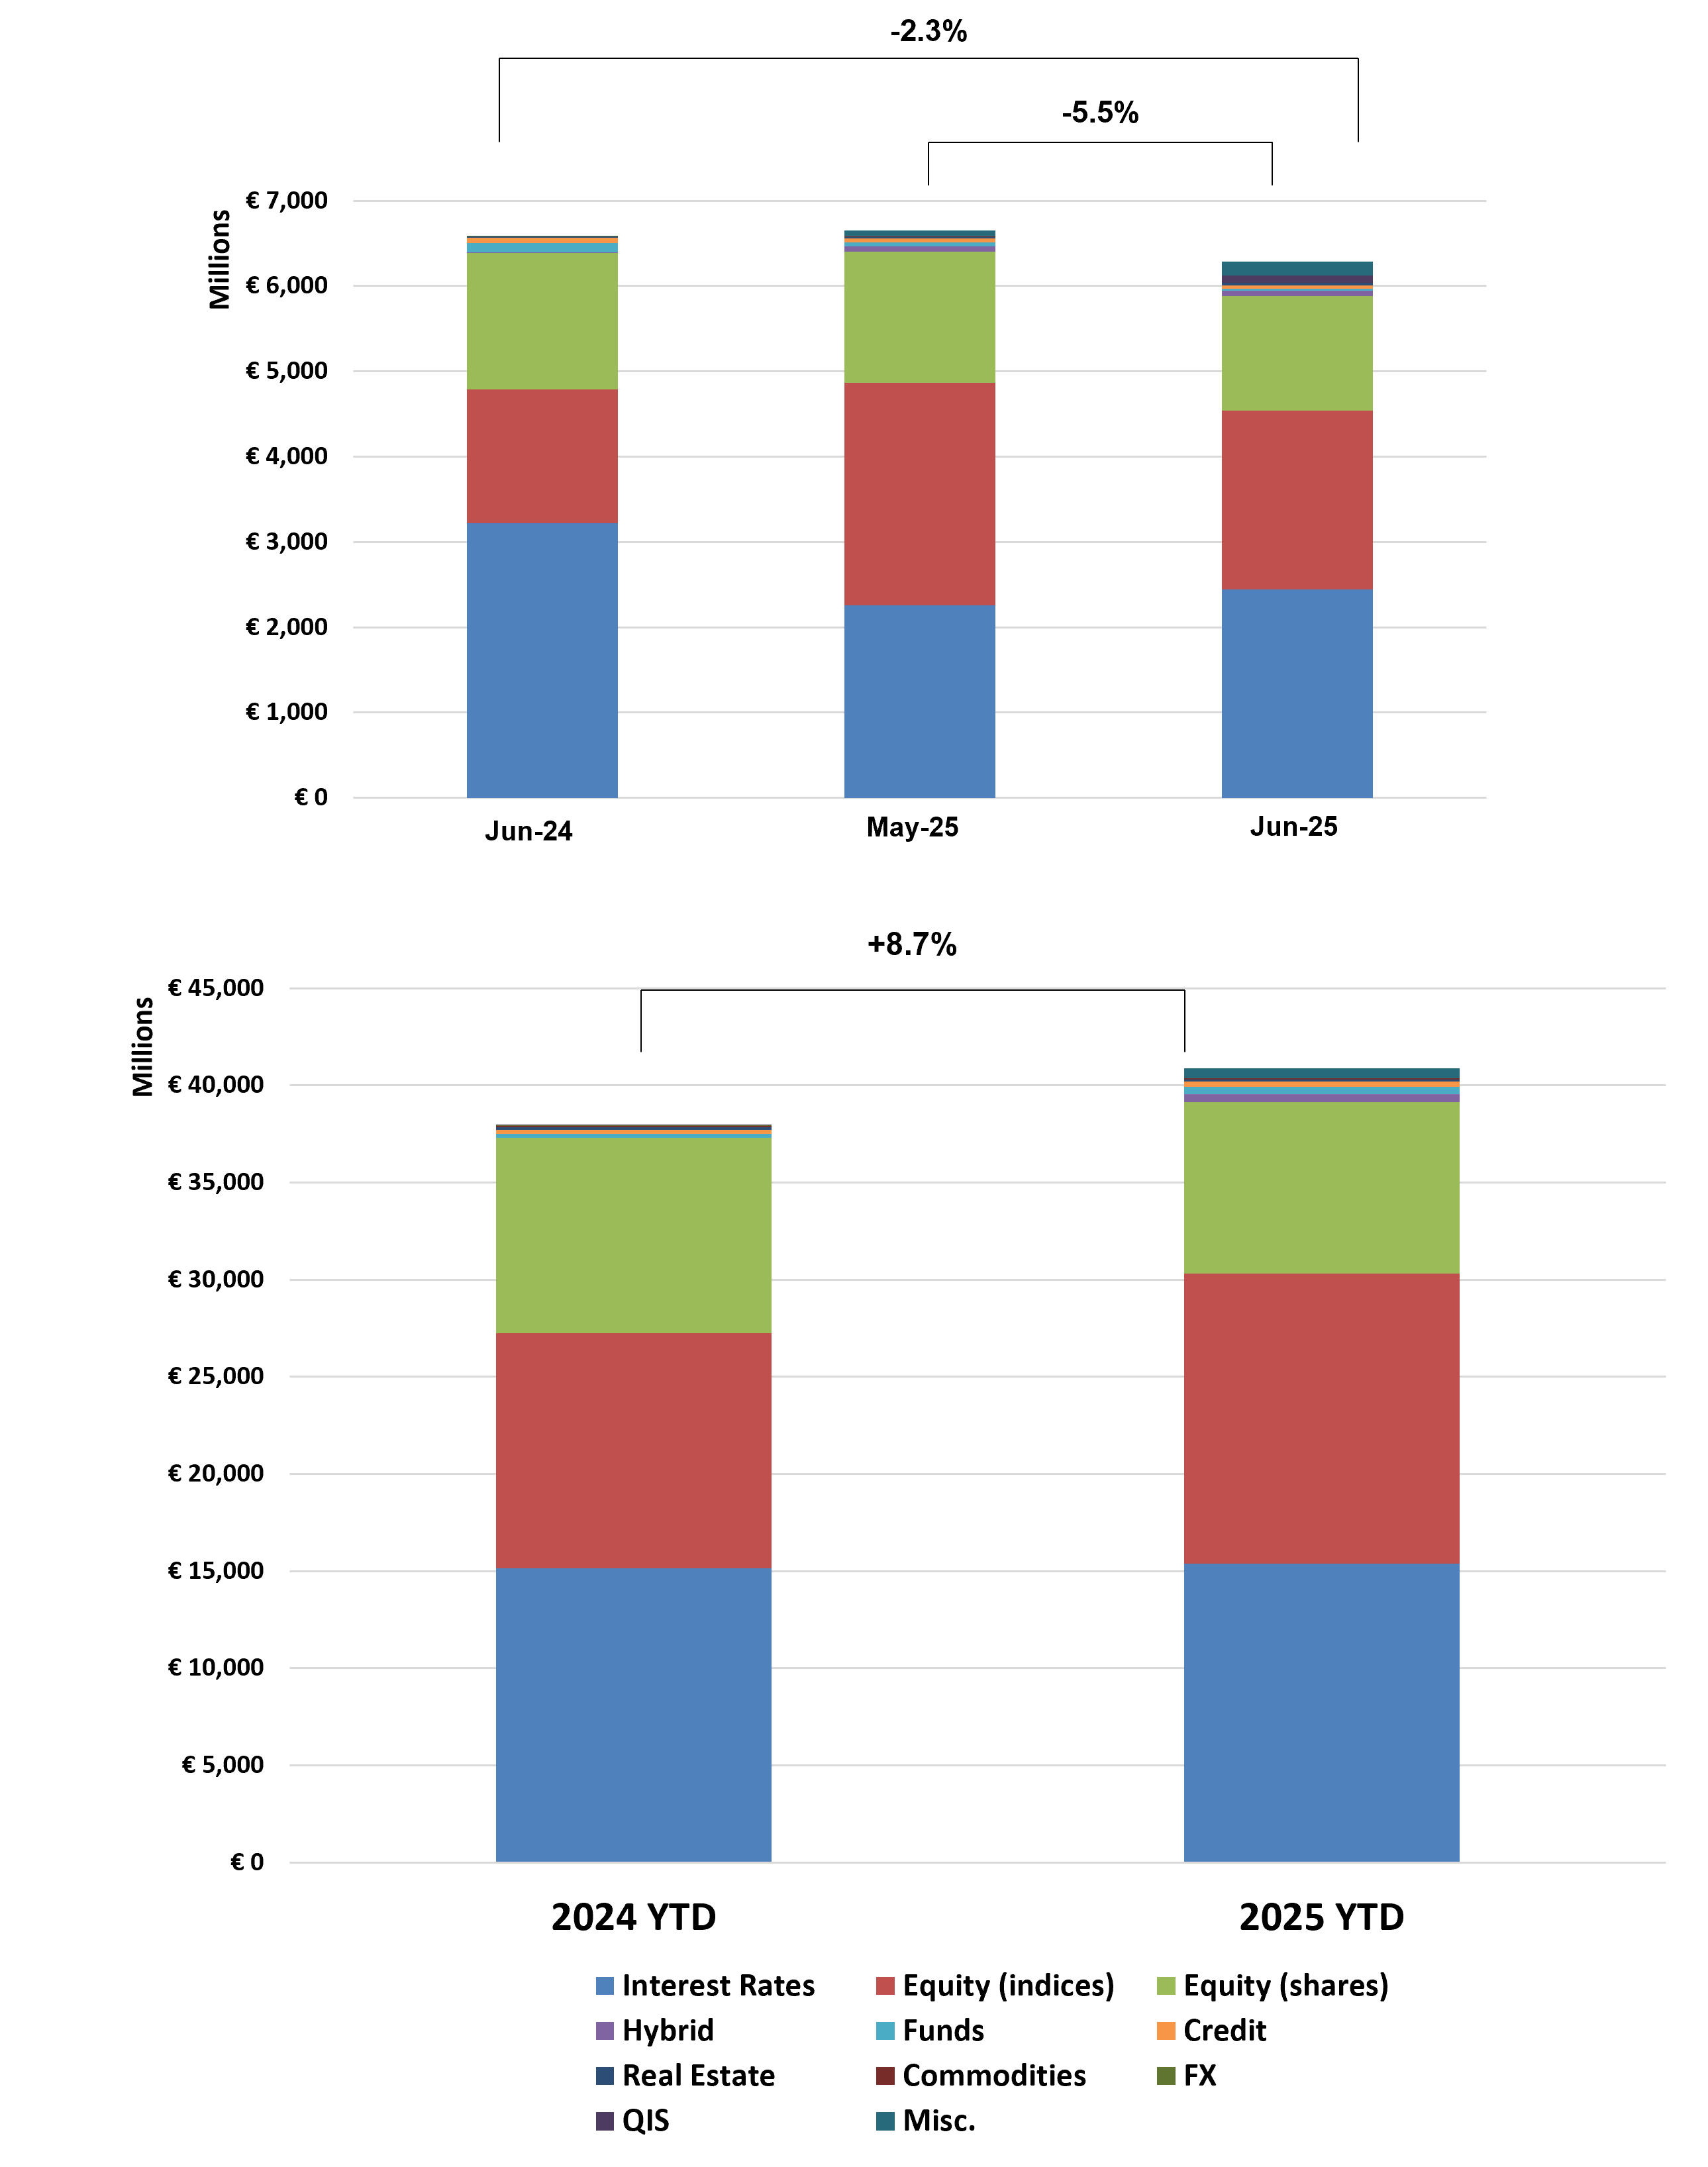
• Issuance Dynamics: Year-to-date volumes reached EUR 40.8Bn (+8.7% YoY); June issuance totaled EUR 6.2Bn (-2.3% YoY), with Q2 down -4.8% YoY due to a high base effect.
• Structure Mix: Single-underlying products dominate at 87.2%, while worst-of (9.5%) and baskets (3.3%) remain marginal.
• Product Mix: Growth products lead (34.5%), followed by Income (~33%) and Capital Protected (32.2%), indicating balanced allocation.
• Underlying Trends: Interest rates lead with 37.6%, closely followed by equity indices (36.6%); single stocks (21.6%) remain secondary.
• Payoff Structures: Complex products continue to grow (35.9%), followed by barrier digital (26.5%) and barrier phoenix (17.3%).
Market Overview
June data highlights a resilient French structured products market, with year-to-date issuance reaching EUR 40.8Bn (+8.7% YoY) despite a gradual decline in monthly volumes since March. The -4.8% YoY decline in Q2 reflects primarily a base effect from strong 2024 comparables, rather than a structural weakening in demand. The market remains highly concentrated in single-underlying structures (87.2%), reinforcing its simplicity-driven profile. Product allocation continues to be well-balanced, with growth (34.5%), income (~33%), and capital-protected (32.2%) segments all maintaining significant shares. A key development is the shift toward interest rate-linked products (37.6%), which now slightly exceed equity index exposure (36.6%), highlighting increased investor focus on rates-driven opportunities. Structurally, the growing dominance of complex products (35.9%), alongside stable barrier-based payoffs, indicates a continued preference for engineered return structures. Overall, June reflects a moderating yet resilient market, characterized by solid YTD growth, stable structuring trends, and a balanced allocation between equity and rates exposures.
Methodology & Notes
This report is based on SPi’s proprietary database of structured products distributed in France. Figures reflect best-effort estimates based on available market data at the time of publication.
Disclaimers
Data Disclaimer (Best Effort / Completeness)
The information presented in this report is based on data collected from a variety of public and proprietary sources. While reasonable care has been taken to ensure accuracy, the data may be incomplete, subject to revisions, or may not capture the entirety of the market. SPi makes no representation or warranty, express or implied, as to the accuracy, completeness, or timeliness of the information.
General Disclaimer
This document is provided for informational purposes only and does not constitute investment advice, an offer, or a recommendation to buy or sell any financial instrument or to adopt any investment strategy. The views expressed are those of SPi at the date of publication and are subject to change without notice. Past performance is not indicative of future results.
SPi accepts no liability for any loss arising from the use of this report or its contents.


