
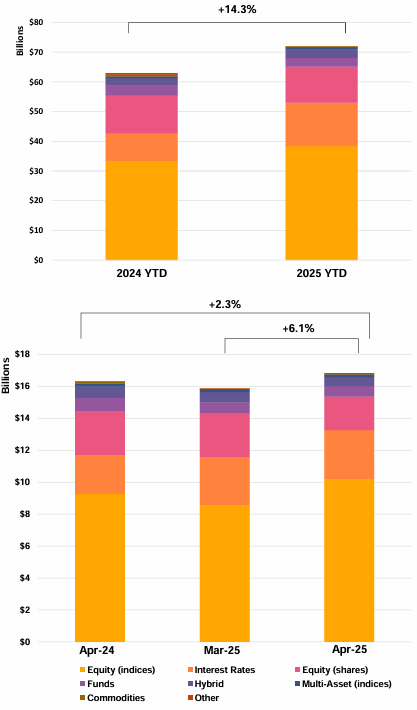
YTD Issuance Reaches USD 71.9Bn (+14.3% YoY) as Monthly Volumes Rise to USD 16.84Bn (+6.1% MoM, +2.3% YoY)
Key Highlights
• Underlying Trends: Equity indices remain dominant (€10.2Bn vs €9.28Bn YoY), while rates-linked products gained traction (€3.06Bn vs €2.43Bn); single stocks declined to €2.1Bn (vs €2.8Bn prior month).
• Structure Mix: Single underlyings stable at 64.8% YTD, baskets at 4.1%; worst-of structures remain resilient at 31.1% share.
• Payoff Preferences: Barrier phoenix leads (27%), followed by fixed rate (20.5%); payoff diversification increased to 27.3% (+1ppt).
• Risk & Protection: Capital-protected products +30.5% YoY YTD; knock-in structures represent 42.9% of YTD volume (+2.2% YoY).
Market Overview
The latest data confirms a continued expansion in structured product issuance, with YTD volumes reaching USD 71.9Bn (+14.3% YoY) and a moderate monthly increase to USD 16.84Bn (+6.1% MoM). The market remains anchored in equity index exposure, but the steady rise in interest rate-linked products highlights increasing investor focus on rates as a source of yield and diversification. In contrast, the decline in single-stock issuance (down to €2.1Bn) suggests a partial rotation away from idiosyncratic risk following earlier momentum. Structurally, the market continues to favor yield-enhancing strategies, with barrier phoenix products (27%) and knock-in features (42.9% YTD) remaining core building blocks. At the same time, the strong +30.5% YoY growth in capital-protected products and rising payoff diversification (27.3%) indicate a progressive rebalancing toward more defensive and diversified allocations. Overall, the environment reflects stable issuance growth, increasing rates integration, and a balanced approach between yield generation and risk mitigation.
Methodology & Notes
This report is based on SPi’s proprietary database of structured products distributed in the US. Figures reflect best-effort estimates based on available market data at the time of publication.
Disclaimers
Data Disclaimer (Best Effort / Completeness)
The information presented in this report is based on data collected from a variety of public and proprietary sources. While reasonable care has been taken to ensure accuracy, the data may be incomplete, subject to revisions, or may not capture the entirety of the market. SPi makes no representation or warranty, express or implied, as to the accuracy, completeness, or timeliness of the information.
General Disclaimer
This document is provided for informational purposes only and does not constitute investment advice, an offer, or a recommendation to buy or sell any financial instrument or to adopt any investment strategy. The views expressed are those of SPi at the date of publication and are subject to change without notice. Past performance is not indicative of future results.
SPi accepts no liability for any loss arising from the use of this report or its contents.


