
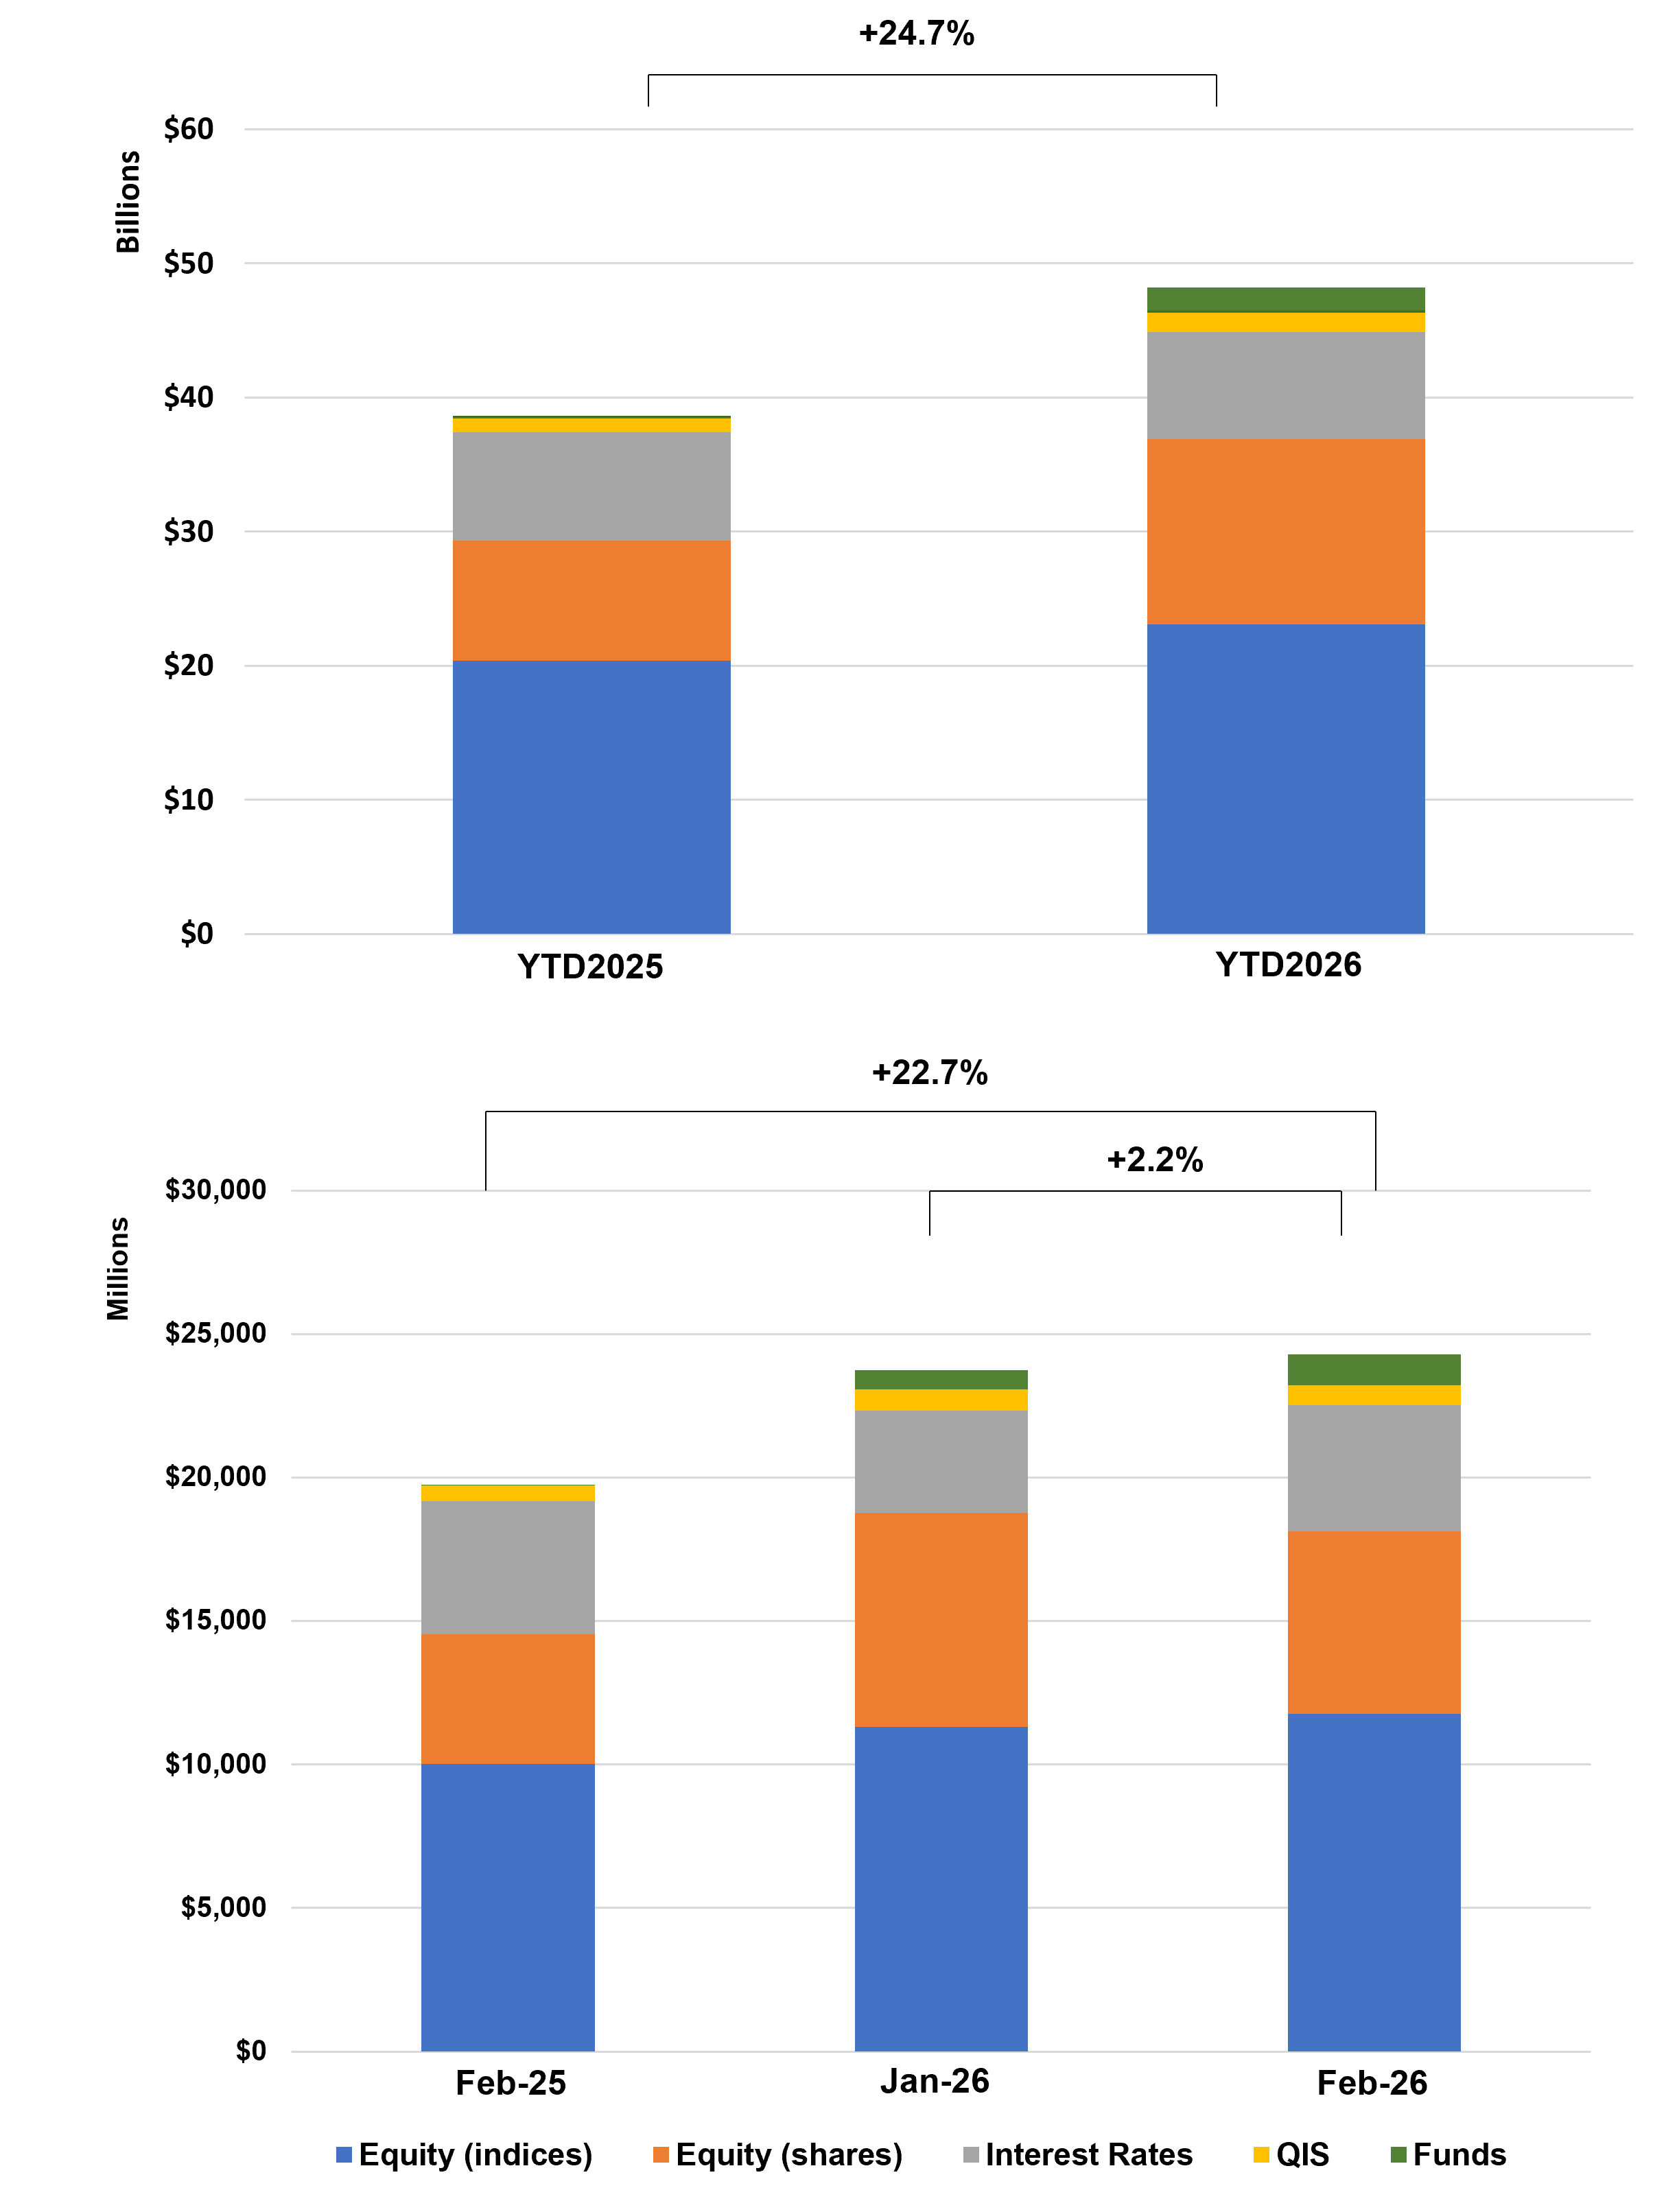
U.S. Structured Products Issuance Reaches USD 24.3Bn (+22.7% YoY) as Worst-of Structures Gain Share at 37.9%
Key Highlights
• Product Mix / Payoffs: Barrier Phoenix (33.9%) remains dominant, followed by Fixed Rates (14.3%), Phoenix (5.5%), Barrier Participation (5.4%), and Barrier Digital (4.8%), confirming continued income-driven structuring.
• Structure Mix: Single-underlying products lead at 58.0%, while worst-of (37.9%) and baskets (4.0%) maintain a strong multi-asset footprint.
• Underlying Trends: Equity indices (47.8%) dominate, followed by equity shares (28.7%) and interest rates (16.5%), highlighting continued equity-centric demand.
• Alternatives Growth: Funds (3.6%) and QIS (3.0%) continue to expand, reflecting increasing interest in diversified and systematic exposures.
Market Overview
February 2026 confirms the continued strength of the U.S. structured products market, with issuance reaching USD 24.3Bn (+22.7% YoY) and supported by robust demand for yield-enhancing structures. A key trend is the continued expansion of worst-of formats (37.9%), reinforcing their role as a core yield-enhancement mechanism, while single-underlying products (58.0%) remain the dominant format. Structurally, the market continues to be anchored by barrier-based payoffs, with Barrier Phoenix structures (33.9%) leading issuance and confirming the centrality of conditional income strategies. Fixed-rate and traditional phoenix structures further support the income-oriented profile of the market, while barrier participation and digital formats maintain a steady presence across growth-oriented allocations. On the asset side, equity exposure remains the primary driver, with equity indices (47.8%) and single stocks (28.7%) together accounting for over three-quarters of issuance, while interest rate-linked products (16.5%) provide diversification. The continued growth in fund-linked (3.6%) and QIS-linked (3.0%) structures highlights a gradual broadening of the underlying universe, particularly toward systematic strategies. Overall, February reflects a mature, yield-driven market, characterized by strong equity linkage, sustained demand for worst-of structures, and incremental innovation in underlying exposures.
Methodology & Notes
This report is based on SPi’s proprietary database of structured products distributed in the United States. Figures reflect best-effort estimates based on available market data at the time of publication.
Disclaimers
Data Disclaimer (Best Effort / Completeness)
The information presented in this report is based on data collected from a variety of public and proprietary sources. While reasonable care has been taken to ensure accuracy, the data may be incomplete, subject to revisions, or may not capture the entirety of the market. SPi makes no representation or warranty, express or implied, as to the accuracy, completeness, or timeliness of the information.
General Disclaimer
This document is provided for informational purposes only and does not constitute investment advice, an offer, or a recommendation to buy or sell any financial instrument or to adopt any investment strategy. The views expressed are those of SPi at the date of publication and are subject to change without notice. Past performance is not indicative of future results.
SPi accepts no liability for any loss arising from the use of this report or its contents.


