
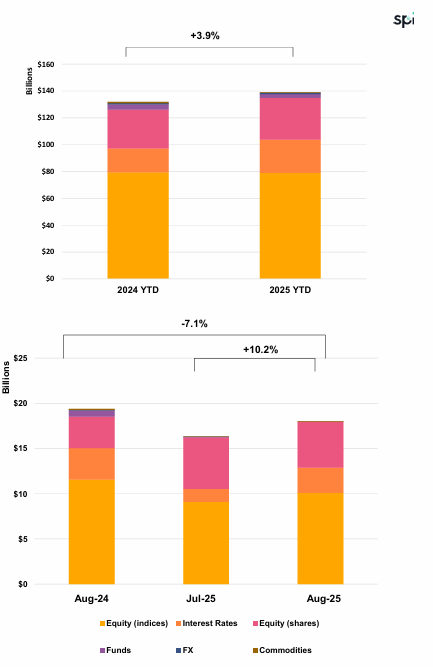
YTD Issuance Reaches USD 138.9Bn (+3.9% YoY) as August Volumes Rise +10.2% MoM Despite Softer YoY Levels
Key Highlights
• Product Mix: Growth products lead with 41.6% share, followed by Income (35.2%) and Capital Protected (23.2%); capital-protected volumes surged +72% MoM.
• Payoff Preferences: Barrier phoenix (31.5%) and fixed rate (20.1%) remain dominant; Barrier Participation leads within Growth at 6.3% YTD.
• Underlying Mix: Equity indices dominate (56.7%), followed by single stocks (22.3%) and rates (17.9%), reinforcing equity-driven demand.
• Risk & Structuring: Knock-in products represent 44.4% YTD; single underlyings stable at 65.3%. Worst-of structures stable at 30.0%, while baskets remain limited at 4.7%.
Market Overview
August data confirms a continued recovery in monthly issuance (+10.2% MoM), bringing year-to-date volumes to USD 138.9Bn (+3.9% YoY), although year-over-year momentum remains subdued. The most notable development is the sharp increase in capital-protected products (+72% MoM), driving their share to 23.2% YTD, which signals a clear rotation toward more defensive positioning. Despite this, Growth products (41.6%) and Income structures (35.2%) continue to anchor the market, reflecting a balanced allocation between yield generation and capital preservation. The sustained dominance of barrier phoenix payoffs (31.5%) and high knock-in penetration (44.4%) indicates that yield-enhancing strategies remain structurally embedded, even as protection demand rises. Underlying allocation remains heavily skewed toward equity indices (56.7%), with stable contributions from single stocks and rates, supporting a diversified exposure framework. Overall, the market reflects a dual dynamic of recovering issuance activity and increasing risk aversion, with investors layering protection while maintaining exposure to yield and growth opportunities.
Methodology & Notes
This report is based on SPi’s proprietary database of structured products distributed in the US. Figures reflect best-effort estimates based on available market data at the time of publication.
Disclaimers
Data Disclaimer (Best Effort / Completeness)
The information presented in this report is based on data collected from a variety of public and proprietary sources. While reasonable care has been taken to ensure accuracy, the data may be incomplete, subject to revisions, or may not capture the entirety of the market. SPi makes no representation or warranty, express or implied, as to the accuracy, completeness, or timeliness of the information.
General Disclaimer
This document is provided for informational purposes only and does not constitute investment advice, an offer, or a recommendation to buy or sell any financial instrument or to adopt any investment strategy. The views expressed are those of SPi at the date of publication and are subject to change without notice. Past performance is not indicative of future results.
SPi accepts no liability for any loss arising from the use of this report or its contents.


