U.S. Structured Products Issuance Reaches USD 23.66Bn (+23.5% YoY) as Worst-of Structures Drive Year-to-Date Expansion
Key Highlights
- Structure Mix: Worst-of structures were the fastest growing structure of the year at 37.9% of YTD volume (USD 74.28Bn), up 73.0% YoY against market growth of 38.8%, with single underlying deals falling from 65.0% to 57.3% and baskets at 4.8%, confirming sustained appetite for correlation-sensitive construction.
- Payoff Structures: Barrier phoenix remains the leading payoff type at 34.7% of YTD volume (USD 68.05Bn), more than double fixed income rates products at 12.2% (USD 23.90Bn), reinforcing the dominance of contingent coupon mechanics.
- Barrier Levels: Knock-in barriers on barrier phoenix reached 61.0% of initial in August, the deepest monthly reading in the two-year series, while the all-subtype average of 68.6% YTD against 65.7% a year earlier points to shallower protection at market level.
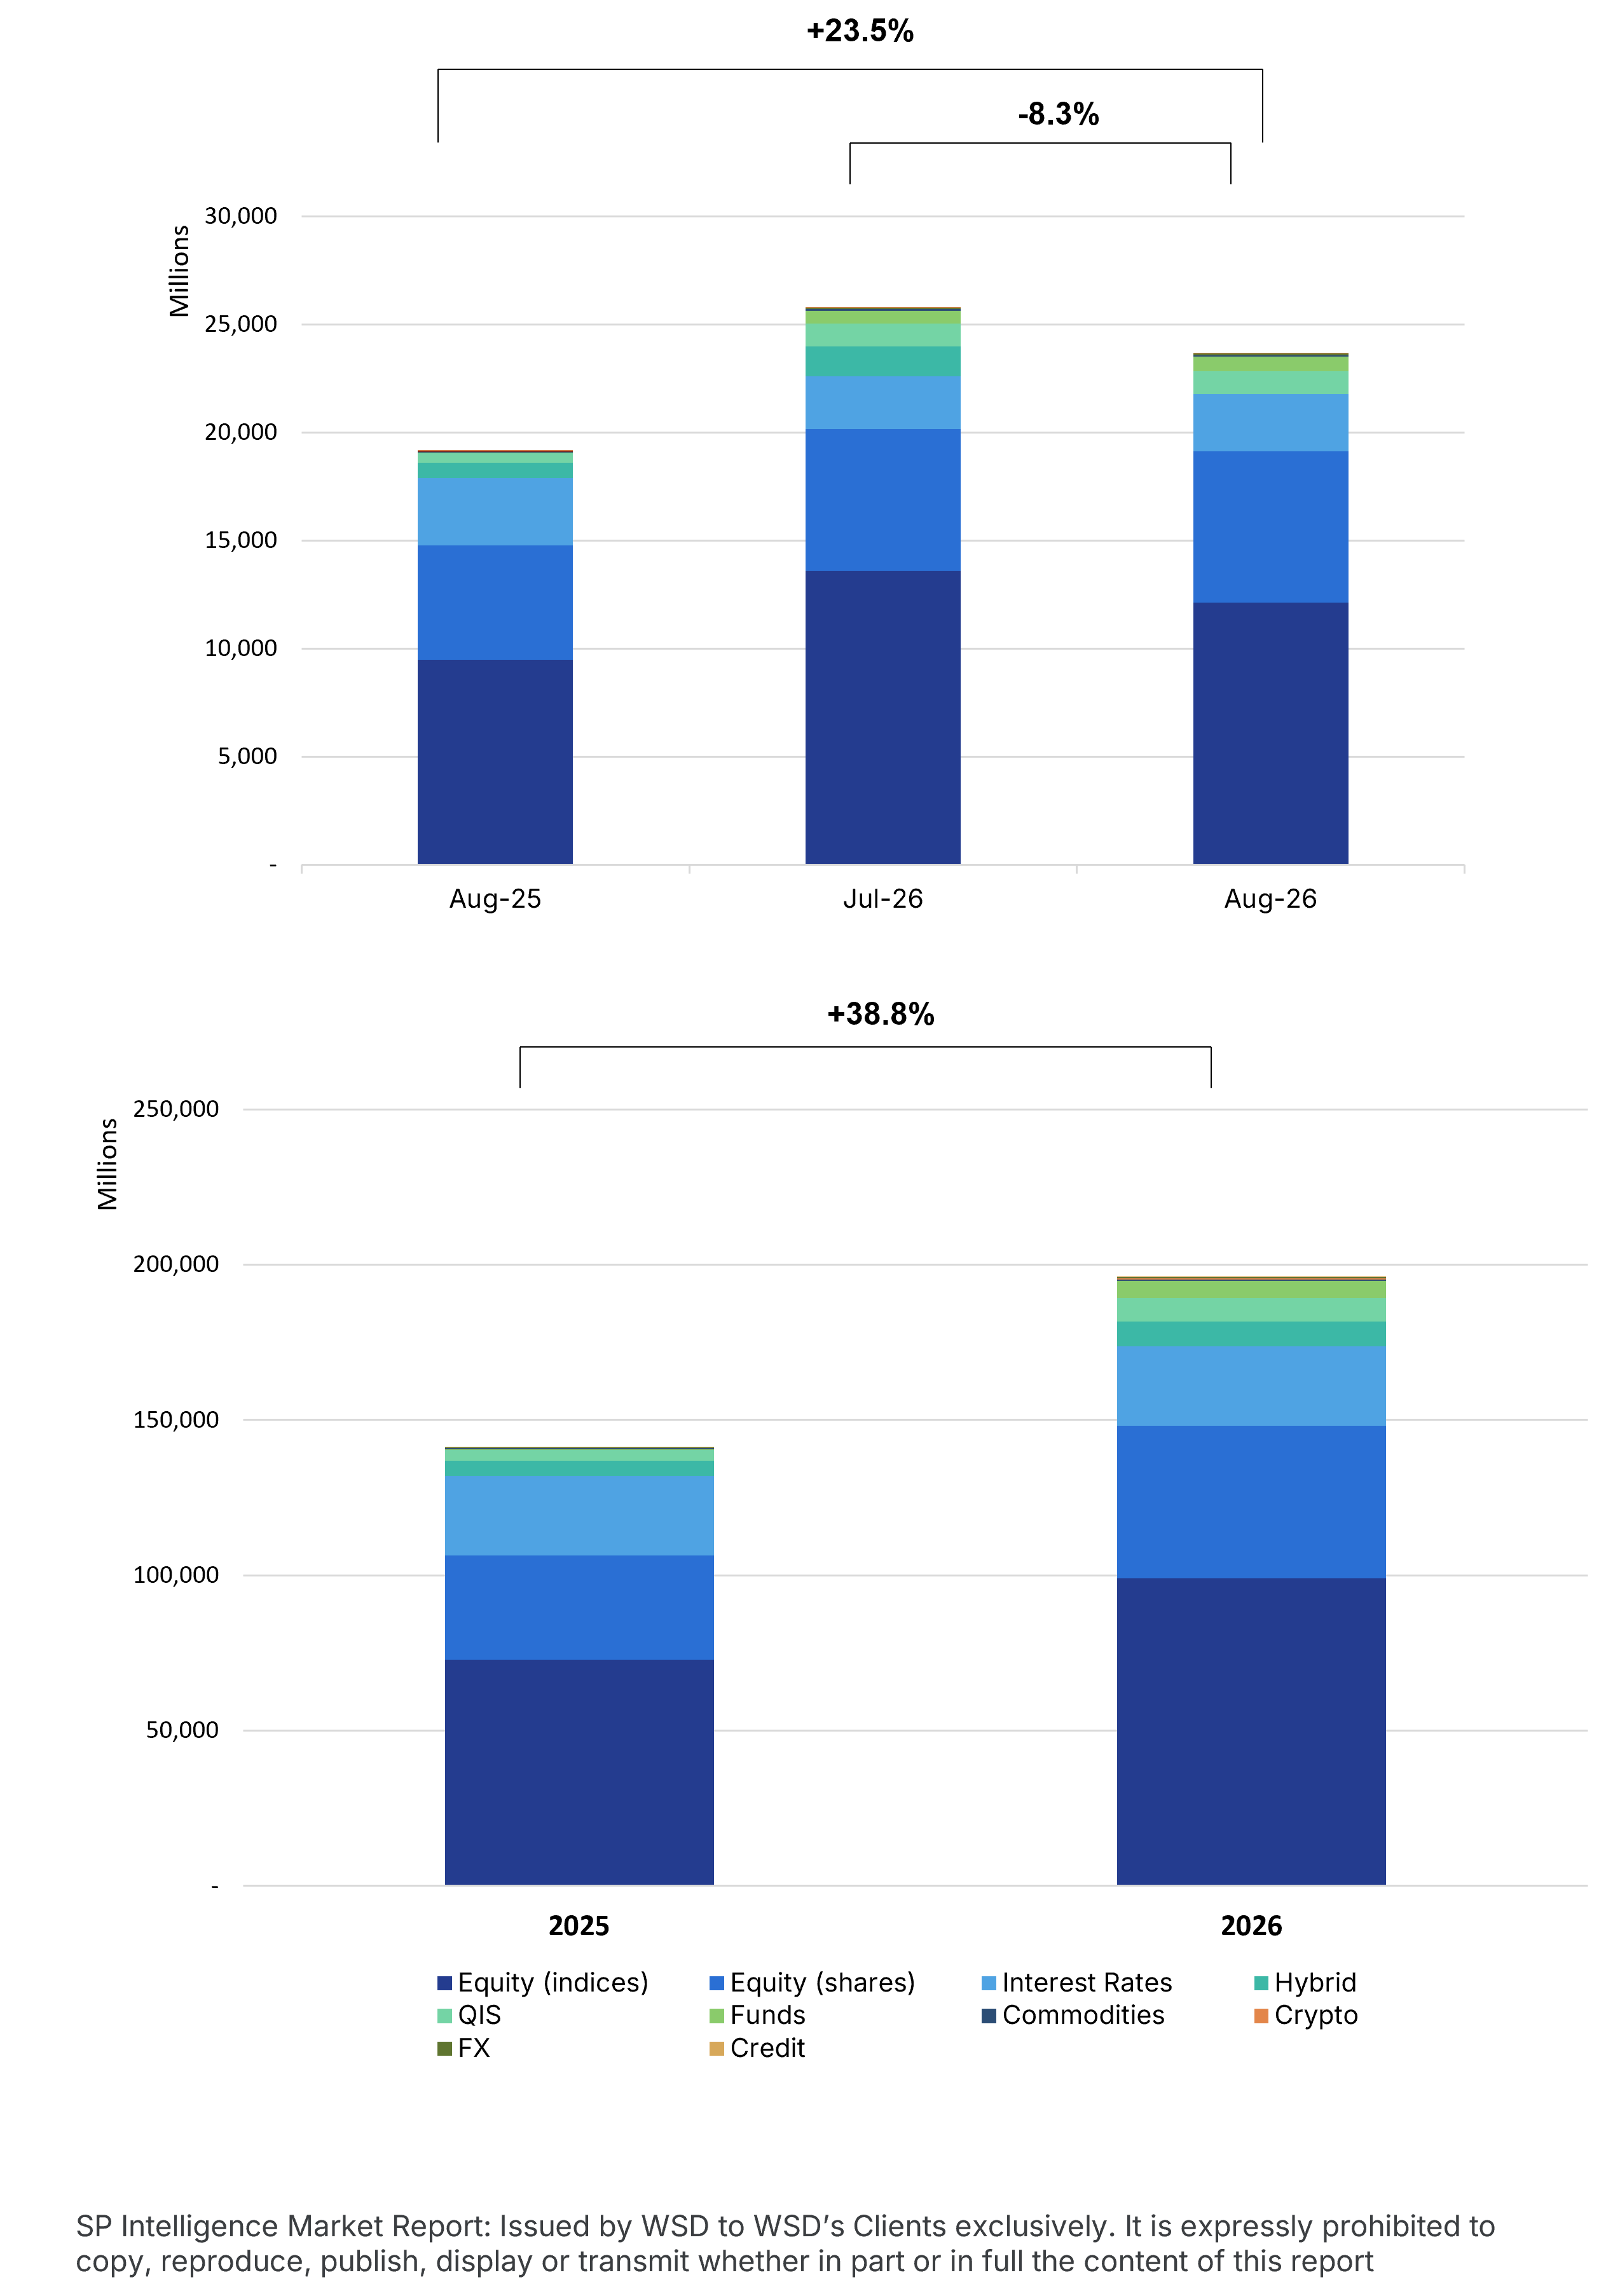
- Asset Allocation: Equity (indices) accounts for 50.5% of YTD volume (approximately USD 99.0Bn) and equity (shares) a further 25.1% (approximately USD 49.2Bn), taking combined equity exposure to 75.6% and underlining an equity-led market.
- Rates Exposure: Interest rates follow at 13.1% (approximately USD 25.7Bn), with the market excluding rates linked issuance at USD 21.01Bn in August (up 30.9% YoY) and USD 170.44Bn YTD (up 47.3% YoY), while capital protected structures ease to 17.9% of YTD volume from 23.7%.
Market Overview
August 2026 confirms the continued strength of the U.S. market and the structural shift towards multi-underlying construction. Issuance totalled USD 23.66Bn, up 23.5% YoY, taking 2026 YTD volume to USD 196Bn, up 38.8% YoY, while excluding rates linked issuance the market reached USD 21.01Bn in the month, up 30.9% YoY, and USD 170.44Bn YTD, up 47.3% YoY. Capital protected structures have fallen to 17.9% of YTD volume from 23.7% a year earlier. Worst-of structures were the fastest growing structure of the year, at 37.9% of YTD volume (USD 74.28Bn) and up 73.0% YoY, their share rising from 30.4% and taken from single underlying deals, which fall from 65.0% to 57.3% despite growing 22.3% in absolute terms. Barrier phoenix remains the leading payoff type at 34.7% (USD 68.05Bn), more than double fixed income rates products at 12.2% (USD 23.90Bn). Average knock-in barriers on barrier phoenix reached 61.0% of initial in August, the deepest monthly reading in the two-year series, while the all-subtype average sits at 68.6% YTD against 65.7% a year earlier. Equity linked issuance dominates the asset allocation, with equity (indices) at 50.5% and equity (shares) at 25.1%, a combined 75.6%, ahead of interest rates at 13.1%. Overall, August reflects a fast-growing, risk-tolerant market, combining strong issuance growth, deepening worst-of penetration, and continued dominance of equity-linked, barrier-driven construction.
Methodology & Notes
This report is based on SPi's proprietary database of structured products distributed in the United States. Figures reflect best-effort estimates based on available market data at the time of publication.
Disclaimers
Data Disclaimer (Best Effort / Completeness)
The information presented in this report is based on data collected from a variety of public and proprietary sources. While reasonable care has been taken to ensure accuracy, the data may be incomplete, subject to revisions, or may not capture the entirety of the market. SPi makes no representation or warranty, express or implied, as to the accuracy, completeness, or timeliness of the information.
General Disclaimer
This document is provided for informational purposes only and does not constitute investment advice, an offer, or a recommendation to buy or sell any financial instrument or to adopt any investment strategy. The views expressed are those of SPi at the date of publication and are subject to change without notice. Past performance is not indicative of future results.
SPi accepts no liability for any loss arising from the use of this report or its contents.