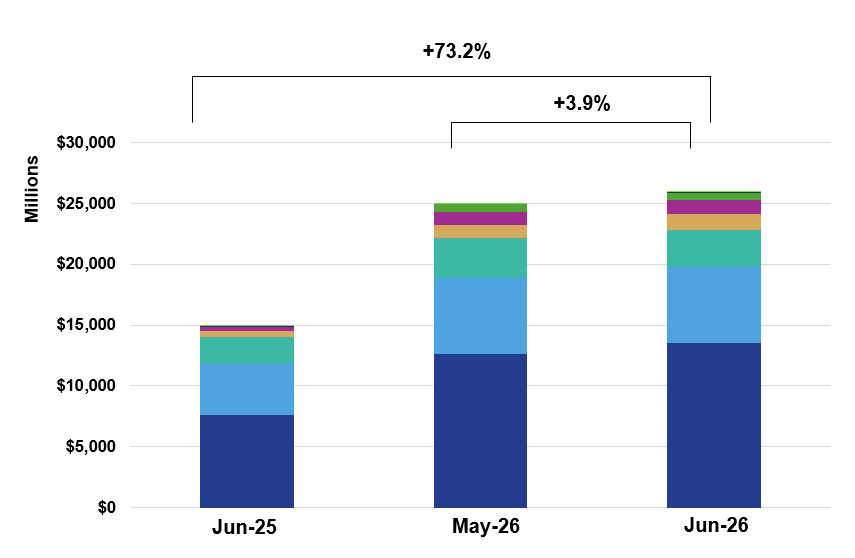
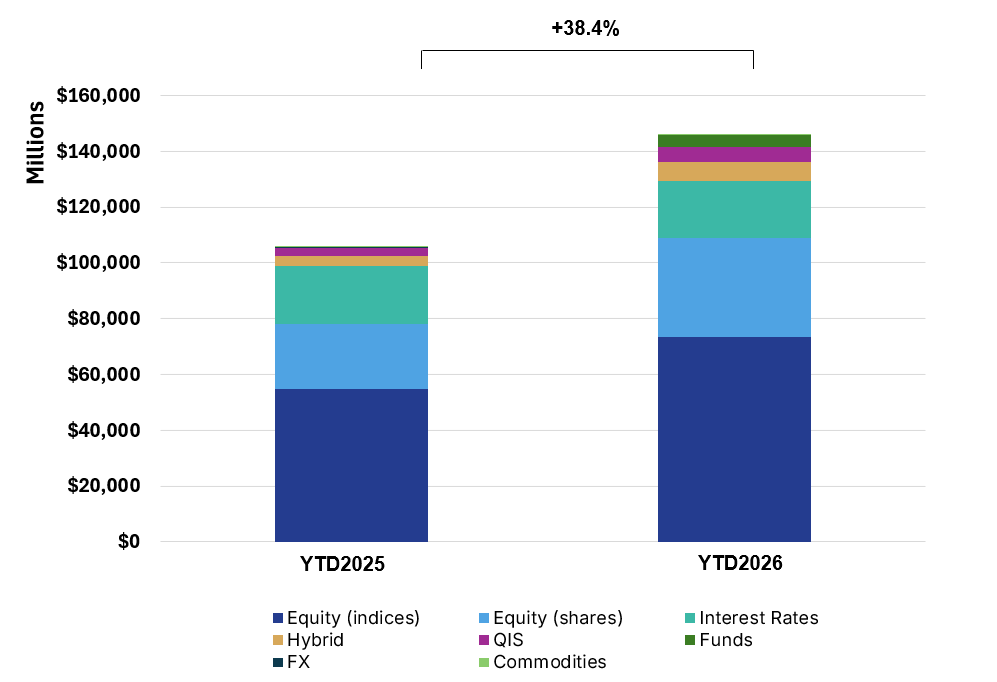
U.S. Structured Products Issuance Reaches USD 146.6Bn YTD (+38.4% YoY) as June Volumes Surge 73.2% YoY on Record Worst-of Activity
Key Highlights
* Product Mix: Growth and Income together account for approximately 81% of flow, split between Income (42.5%) and Growth (38.7%), while Capital Protected represents 18.8% of volumes.
* Income Momentum: Income products reached a year-to-date high of USD 12.4Bn in June, roughly 48% of monthly issuance, driven primarily by Barrier Phoenix structures at USD 9.8Bn, their strongest month of the year.
* Structure Mix: Single-underlying structures lead at 57.7% YTD with Worst-of at 37.7%, though Worst-of accounted for roughly 41% of June issuance, reflecting sustained demand for enhanced yield and autocallable-style formats.
* Record Worst-of Issuance: Worst-of volumes reached USD 10.7Bn in June, the strongest monthly total on record, surpassing the previous peak of USD 10.3Bn set in October 2025 and bringing YTD volume to approximately USD 55.2Bn.
* Underlying Trends: Barrier Phoenix activity was led by the NDX/RTY/SPX combination at USD 2.1Bn, with the largest month-on-month increases coming from multi-index baskets blending U.S. and European benchmarks alongside single-stock exposure to Alphabet and Amazon.
* Asset Allocation: Non-rate issuance totalled approximately USD 125.8Bn YTD (+48.2% YoY), the large majority equity-linked, with Interest Rate-linked issuance accounting for the remaining USD 20.8Bn.
Market Overview
June 2026 confirms the exceptional momentum of the U.S. structured products market, with year-to-date issuance reaching USD 146.6Bn (+38.4% YoY) and monthly volumes surging 73.2% YoY. The product mix remains firmly oriented toward market-linked exposure, with growth and income strategies together accounting for approximately 81% of flow, split between income (42.5%) and growth (38.7%), while capital-protected solutions represent 18.8%. Income issuance reached a year-to-date high of USD 12.4Bn in June, close to half of monthly volumes, driven primarily by Barrier Phoenix structures at USD 9.8Bn in their strongest month of the year. Structurally, single-underlying formats retain the majority of issuance at 57.7% YTD against 37.7% for worst-of, but June marked a decisive step up in correlation-sensitive activity: worst-of volumes reached USD 10.7Bn, the strongest monthly total on record, surpassing the previous peak of USD 10.3Bn set in October 2025 and taking year-to-date volume to approximately USD 55.2Bn, or roughly 41% of June issuance. Underlying selection centred on multi-index baskets, led by the NDX/RTY/SPX combination at USD 2.1Bn, with growth concentrated in structures blending U.S. and European benchmarks alongside single-stock exposure to Alphabet and Amazon. Non-rate issuance of approximately USD 125.8Bn YTD (+48.2% YoY) confirms the equity-centric bias, with interest rate-linked activity at USD 20.8Bn. Overall, June reflects a market operating at record intensity, combining accelerating issuance, income-led allocation, and unprecedented demand for worst-of yield enhancement.
Methodology & Notes
This report is based on SPi's proprietary database of structured products distributed in the United States. Figures reflect best-effort estimates based on available market data at the time of publication.
Disclaimers
Data Disclaimer (Best Effort / Completeness)
The information presented in this report is based on data collected from a variety of public and proprietary sources. While reasonable care has been taken to ensure accuracy, the data may be incomplete, subject to revisions, or may not capture the entirety of the market. SPi makes no representation or warranty, express or implied, as to the accuracy, completeness, or timeliness of the information.
General Disclaimer
This document is provided for informational purposes only and does not constitute investment advice, an offer, or a recommendation to buy or sell any financial instrument or to adopt any investment strategy. The views expressed are those of SPi at the date of publication and are subject to change without notice. Past performance is not indicative of future results.
SPi accepts no liability for any loss arising from the use of this report or its contents.