
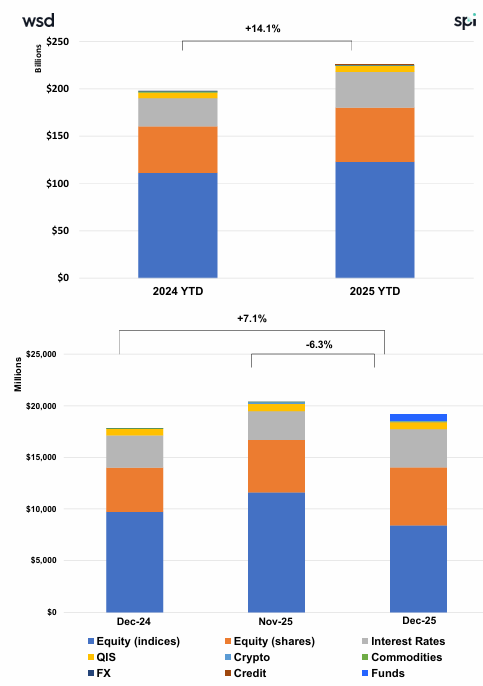
US Structured Products Issuance Hits Record USD 226Bn in 2025 (+14.1% YoY), Driven by Strong Q4 Momentum and Barrier-Led Demand.
Key Highlights
• Product Mix: Growth structures led with 39.8%, followed closely by Income (38.4%); Capital Protected (21.9%) rebounded into year-end after earlier softness.
• Structure Trends: Single underlyings grew +10.7% YoY but share declined to 62.3% (from 64.3%); worst-of (33.0%) and baskets (4.5%) both gained share, confirming shift to multi-underlyings.
• Correlation Exposure: Worst-of growth driven by 3-name (USD 50.7Bn, +14.4% YoY) and 2-name (USD 21.9Bn, +20.6% YoY) structures; 4-name nearly doubled (+96.5% YoY), reflecting increased yield optimization.
• Payoff Preferences: Barrier phoenix led (USD 69.7Bn, +9.2% YoY); barrier-based products surged to USD 104.8Bn (+16.5% YoY), dominating across income and growth. Fixed rate saw strongest absolute growth (+USD 6.9Bn, +23.1% YoY); Barrier Participation also expanded sharply (+54.0% YoY).
Market Overview
2025 marks a record year for US structured products issuance, reaching USD 226Bn (+14.1% YoY), driven by a powerful Q4 acceleration (USD 63.7Bn, +23.0% YoY) and sustained investor demand across market conditions. The year was characterized by a clear structural evolution, with a progressive shift toward multi-underlying formats, as worst-of (33.0%) and basket structures (4.5%) gained share at the expense of single names. This reflects a growing willingness to monetize correlation and enhance yields, particularly through 2- and 3-name structures, while increased adoption of 4-name formats signals rising sophistication. At the same time, barrier-based payoffs have become the dominant design paradigm, with volumes reaching USD 104.8Bn (+16.5% YoY), underpinning both income (phoenix) and growth (barrier participation) strategies. The resilience of Growth (39.8%) and Income (38.4%) segments, alongside a late-year rebound in capital-protected products, highlights a well-balanced market accommodating both yield generation and downside protection needs. Elevated knock-in penetration (48.0%) and stable barrier levels (~65%) further confirm consistent risk calibration despite higher issuance volumes. Overall, 2025 reflects a mature expansion phase, combining record issuance, increased structural complexity, and strong investor appetite for yield-enhancing, equity-linked solutions.
Methodology & Notes
This report is based on SPi’s proprietary database of structured products distributed in the US. Figures reflect best-effort estimates based on available market data at the time of publication.
Disclaimers
Data Disclaimer (Best Effort / Completeness)
The information presented in this report is based on data collected from a variety of public and proprietary sources. While reasonable care has been taken to ensure accuracy, the data may be incomplete, subject to revisions, or may not capture the entirety of the market. SPi makes no representation or warranty, express or implied, as to the accuracy, completeness, or timeliness of the information.
General Disclaimer
This document is provided for informational purposes only and does not constitute investment advice, an offer, or a recommendation to buy or sell any financial instrument or to adopt any investment strategy. The views expressed are those of SPi at the date of publication and are subject to change without notice. Past performance is not indicative of future results.
SPi accepts no liability for any loss arising from the use of this report or its contents.


