
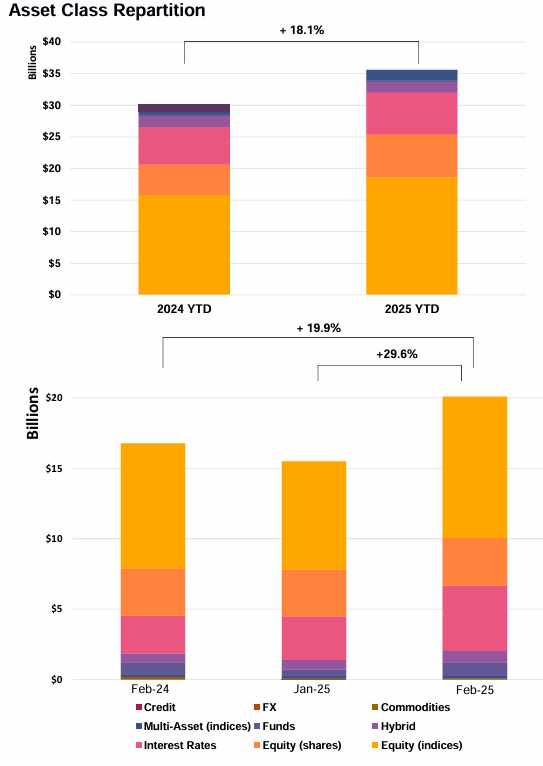
February Issuance Rebounds to USD 20.08Bn, up +29.6% MoM and +19.9% YoY, Signalling Strong Recovery in Structured Product Activity
Key Highlights
• Underlying Mix: Single underlyings surged +39.9% MoM, reaching 64.7% YTD share (USD 23Bn); baskets remain marginal at 3.6%. Worst-of structures stable at 31.7% share.
• Equity Exposure: 52.2% YTD linked to equity indices vs. 18.6% single stocks; index-linked issuance rose +29.7% MoM, signalling renewed demand for broad market exposure.
• Payoff Preferences: Barrier phoenix remains dominant (30.7%), followed by fixed rate (21.1%); payoff diversification stable at 24.7%.
• Risk & Protection: Strong growth across structures; Capital-at-Risk +115% MoM, Capital-Protected +45%, buffers +46%; knock-in products grew modestly (+4.8%) but remain dominant at USD 16.1Bn.
Market Overview
February issuance data highlights a clear re-acceleration in structured product activity, with volumes rising to USD 20.08Bn (+29.6% MoM, +19.9% YoY) following January’s dip. The rebound is supported by broad-based growth across product categories, particularly in capital-at-risk structures (+115% MoM), indicating renewed investor appetite for yield enhancement. At the same time, strong increases in capital-protected (+45%) and buffer products (+46%) point to continued demand for downside mitigation, suggesting a balanced risk allocation rather than a pure risk-on shift. The simultaneous expansion in single-name exposure and index-linked issuance (+29.7% MoM) reflects a dual strategy combining alpha opportunities and beta exposure. Overall, February confirms a resilient and expanding issuance environment, driven by sustained yield demand and diversified structuring preferences.
Methodology & Notes
This report is based on SPi’s proprietary database of structured products distributed in the US. Figures reflect best-effort estimates based on available market data at the time of publication.
Disclaimers
Data Disclaimer (Best Effort / Completeness)
The information presented in this report is based on data collected from a variety of public and proprietary sources. While reasonable care has been taken to ensure accuracy, the data may be incomplete, subject to revisions, or may not capture the entirety of the market. SPi makes no representation or warranty, express or implied, as to the accuracy, completeness, or timeliness of the information.
General Disclaimer
This document is provided for informational purposes only and does not constitute investment advice, an offer, or a recommendation to buy or sell any financial instrument or to adopt any investment strategy. The views expressed are those of SPi at the date of publication and are subject to change without notice. Past performance is not indicative of future results.
SPi accepts no liability for any loss arising from the use of this report or its contents.


