
January Structured Products Issuance Soft MoM but Up YoY.
Key Highlights
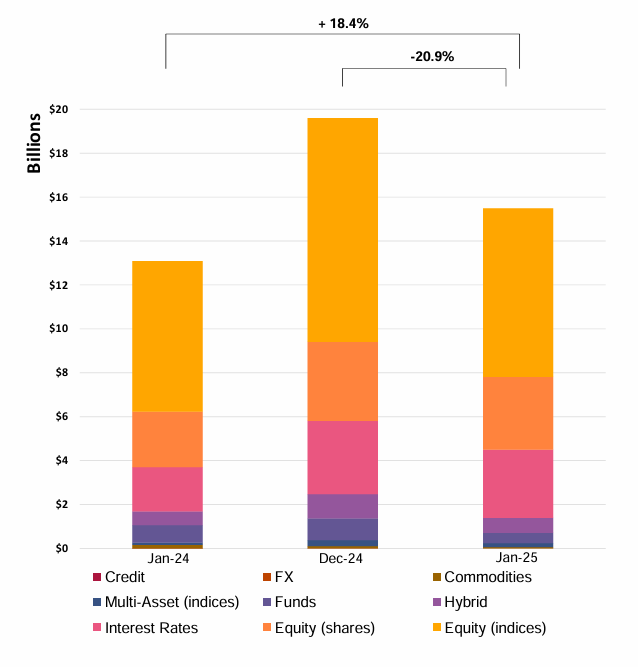
• Issuance: Total volume at USD 15.49Bn, down -21% MoM but up +18.4% YoY, indicating resilient underlying demand despite seasonal slowdown.
• Underlying Mix: Single underlyings dominate at 61.9% (USD 9.55Bn), while baskets remain limited at 4.1%; equity indices still lead (49.6%) but single stocks gaining traction (21.4%).
• Structure Trends: Worst-of structures hold a solid 34.1% share despite declining volumes; knock-in barriers increased to 50.8% (vs. ~45% in 24Q4), signalling higher yield-seeking behaviour.
• Capital Protection: Volumes declined -7.44%, but market share remains stable at 24.9%, suggesting continued demand for defensive structures.
Market Overview
January activity reflects a seasonally softer issuance environment, but the +18.4% YoY growth confirms sustained investor engagement in structured products. The market continues to favour yield-enhancing structures, evidenced by the rise in knock-in barriers (50.8%) and the dominance of barrier phoenix payoffs (35.2%), pointing to continued appetite for conditional income strategies. The strong tilt toward single underlyings (61.9%) and increasing single-stock exposure (21.4%) suggests a gradual shift toward idiosyncratic risk-taking. Meanwhile, the persistence of worst-of exposure (34.1%) indicates investors remain comfortable selling correlation risk, albeit more selectively. Despite a decline in volumes, capital-protected products (24.9% share) highlight a still-relevant demand for downside mitigation. Overall, the data suggests a market balancing yield enhancement and selective risk-taking, with a moderate pivot away from broad index exposure toward more targeted strategies.
Methodology & Notes
This report is based on SPi’s proprietary database of structured products distributed in the US. Figures reflect best-effort estimates based on available market data at the time of publication.
Disclaimers
Data Disclaimer (Best Effort / Completeness)
The information presented in this report is based on data collected from a variety of public and proprietary sources. While reasonable care has been taken to ensure accuracy, the data may be incomplete, subject to revisions, or may not capture the entirety of the market. SPi makes no representation or warranty, express or implied, as to the accuracy, completeness, or timeliness of the information.
General Disclaimer
This document is provided for informational purposes only and does not constitute investment advice, an offer, or a recommendation to buy or sell any financial instrument or to adopt any investment strategy. The views expressed are those of SPi at the date of publication and are subject to change without notice. Past performance is not indicative of future results.
SPi accepts no liability for any loss arising from the use of this report or its contents.


