
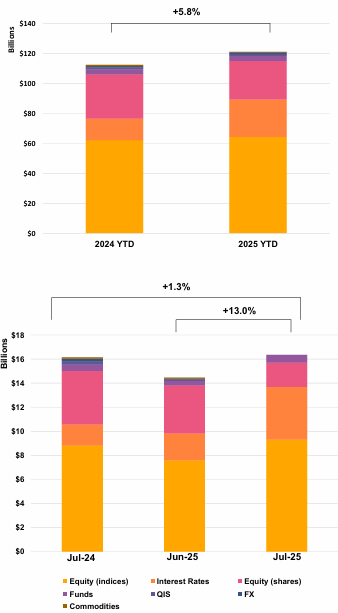
YTD Issuance Reaches USD 121.2Bn (+5.8% YoY) as July Volumes Rebound to USD 16.3Bn (+13% MoM)
Key Highlights
• Product Mix: Income products surged to USD 7.4Bn (+56% MoM), returning to Q1 levels; Growth products remain dominant at 41.9% YTD share.
• Payoff Preferences: Barrier phoenix (26.9%) and fixed rate (17.8%) remain leading structures; Barrier Participation leads within Growth at 5.5% YTD.
• Underlying Mix: Equity indices dominate (53.2%), followed by single stocks (21.3%) and rates (20.6%), confirming diversified exposure.
• Risk & Structuring: Knock-in products represent 43.7% YTD; single underlyings stable at 65.7%. Worst-of structures rebounded to 29.7%, while baskets remain limited at 4.5%.
Market Overview
July data signals a renewed pickup in structured product activity, with issuance rising to USD 16.3Bn (+13% MoM) and pushing year-to-date volumes to USD 121.2Bn (+5.8% YoY). The rebound is largely driven by a sharp recovery in income products (USD 7.4Bn, +56% MoM), which have returned to Q1 levels, indicating a reacceleration in yield-seeking behavior. This is consistent with the sustained dominance of barrier phoenix structures (26.9%) and a stable share of knock-in products (43.7%), highlighting continued investor willingness to monetize volatility. At the same time, Growth products remain the core allocation (41.9%), supported by demand for barrier participation strategies. Structurally, the rebound in worst-of exposure (29.7%) suggests a renewed appetite for correlation risk, reversing the more cautious stance observed in Q2. Meanwhile, the persistent dominance of equity indices (53.2%), alongside balanced allocations to single stocks and rates, reflects a well-diversified underlying mix. Overall, the market appears to be re-entering a more constructive phase, with stronger issuance, revived income demand, and a gradual return to higher-yield structures.
Methodology & Notes
This report is based on SPi’s proprietary database of structured products distributed in the US. Figures reflect best-effort estimates based on available market data at the time of publication.
Disclaimers
Data Disclaimer (Best Effort / Completeness)
The information presented in this report is based on data collected from a variety of public and proprietary sources. While reasonable care has been taken to ensure accuracy, the data may be incomplete, subject to revisions, or may not capture the entirety of the market. SPi makes no representation or warranty, express or implied, as to the accuracy, completeness, or timeliness of the information.
General Disclaimer
This document is provided for informational purposes only and does not constitute investment advice, an offer, or a recommendation to buy or sell any financial instrument or to adopt any investment strategy. The views expressed are those of SPi at the date of publication and are subject to change without notice. Past performance is not indicative of future results.
SPi accepts no liability for any loss arising from the use of this report or its contents.


