
YTD Issuance Exceeds USD 100Bn (+6.5% YoY) as June Volumes Reach USD 14.4Bn (+6.2% YoY) Despite Softer Q2 Trends
Key Highlights
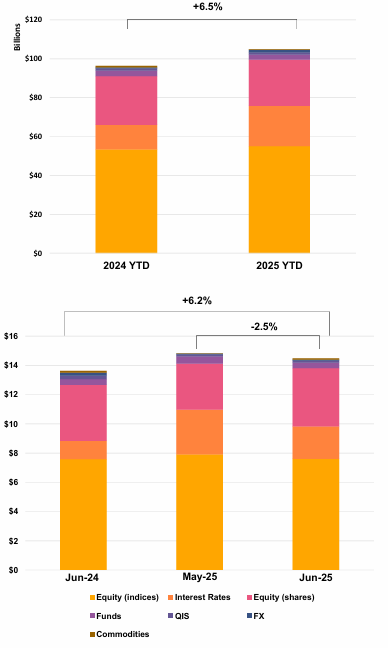
• Issuance: Year-to-date volume reached USD 104.8Bn (+6.5% YoY); June issuance totalled USD 14.4Bn (+6.2% YoY), while Q2 volumes slightly declined (-1.2% YoY).
• Product Mix: Growth products lead with 41.9% share, followed by Income (32.6%) and Capital Protected (25.5%); income products rebounded to USD 4.7Bn (+27.7% MoM).
• Payoff Preferences: Barrier phoenix (25%) and fixed rate (19%) remain dominant; within Growth, Barrier Participation leads with USD 5.7Bn YTD (incl. USD 1.1Bn linked to S&P 500).
• Underlying Mix: Equity indices dominate at 52.6%, followed by equity shares (22.7%) and rates (19.7%), confirming diversified exposure across asset classes.
• Risk & Structuring: Knock-in products represent 41.8% YTD; single underlyings stable at ~two-thirds of the market. Worst-of structures declined to 28.7% vs. baskets rising to 4.7% (vs. 30.1% / 3.3% YoY).
Market Overview
Structured product issuance has surpassed the USD 100Bn mark YTD (USD 104.8Bn, +6.5% YoY), underscoring resilient investor demand despite a softer Q2 (-1.2% YoY). June volumes (USD 14.4Bn, +6.2% YoY) reflect stable primary activity, while the rebound in income products (+27.7% MoM) suggests a partial re-engagement in yield strategies following the earlier slowdown. The market remains anchored by Growth structures (41.9%), with strong traction in barrier participation payoffs, highlighting continued interest in equity upside with protection features. At the same time, the persistent dominance of equity indices (52.6%), alongside meaningful allocations to rates (19.7%), points to a balanced cross-asset allocation framework. Structurally, the gradual decline in worst-of exposure (28.7%) and rise in basket deals (4.7%) indicate a shift away from concentrated correlation risk toward more diversified structures. Overall, the market reflects a stable issuance environment with improving income demand, sustained growth orientation, and incremental diversification in structuring approaches.
Methodology & Notes
This report is based on SPi’s proprietary database of structured products distributed in the US. Figures reflect best-effort estimates based on available market data at the time of publication.
Disclaimers
Data Disclaimer (Best Effort / Completeness)
The information presented in this report is based on data collected from a variety of public and proprietary sources. While reasonable care has been taken to ensure accuracy, the data may be incomplete, subject to revisions, or may not capture the entirety of the market. SPi makes no representation or warranty, express or implied, as to the accuracy, completeness, or timeliness of the information.
General Disclaimer
This document is provided for informational purposes only and does not constitute investment advice, an offer, or a recommendation to buy or sell any financial instrument or to adopt any investment strategy. The views expressed are those of SPi at the date of publication and are subject to change without notice. Past performance is not indicative of future results.
SPi accepts no liability for any loss arising from the use of this report or its contents.


