
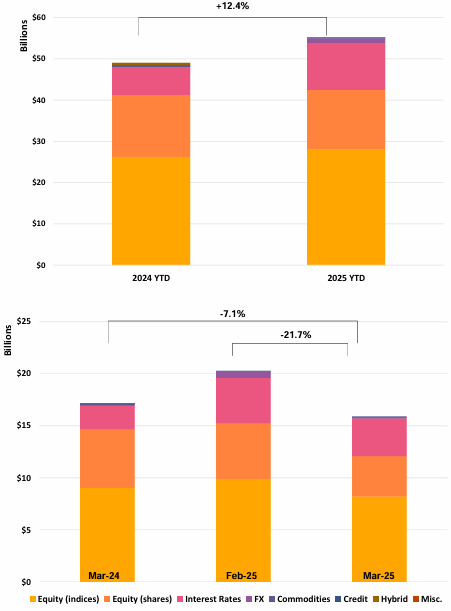
YTD Issuance Reaches USD 55.1Bn (+12.4% YoY) Despite March Slowdown to USD 15.86Bn (-21.7% MoM, -7.1% YoY)
Key Highlights
• Underlying Mix: Single underlyings remain dominant at 64.8% YTD, while baskets edge higher to 4.1%; worst-of structures stable at 31.1% share despite lower volumes.
• Equity Exposure: 51.0% YTD linked to indices vs. 26.1% equities; March saw declines in both single stocks (-27.2% MoM) and indices (-17% MoM).
• Payoff Preferences: Barrier phoenix remains leading (28.5%), followed by fixed rate (20.7%); payoff diversification increased to 26.4% (+2ppt).
• Risk & Protection: Capital-protected products +28% YoY YTD, while knock-in structures +11% YoY, highlighting sustained demand for both protection and yield enhancement.
Market Overview
March data reflects a broad-based slowdown in issuance activity, with volumes declining to USD 15.86Bn (-21.7% MoM, -7.1% YoY) following February’s strong rebound. Despite this, year-to-date issuance remains solid at USD 55.1Bn (+12.4% YoY), indicating that underlying demand for structured products is still intact. The decline was driven by reduced activity across both equity indices (-17% MoM) and single stocks (-27.2% MoM), suggesting a temporary pause in risk deployment rather than a structural shift. The continued dominance of single underlyings (~65%) and stable worst-of exposure (31.1%) point to persistent yield-seeking behavior. Meanwhile, the increase in payoff diversification (+2ppt) and strong YTD growth in capital-protected products (+28%) indicate a gradual rebalancing toward more diversified and defensive structures. Overall, March suggests a tactical pullback in issuance within a still constructive YTD environment, with investors maintaining exposure but adjusting structure and risk profiles.
Methodology & Notes
This report is based on SPi’s proprietary database of structured products distributed in the US. Figures reflect best-effort estimates based on available market data at the time of publication.
Disclaimers
Data Disclaimer (Best Effort / Completeness)
The information presented in this report is based on data collected from a variety of public and proprietary sources. While reasonable care has been taken to ensure accuracy, the data may be incomplete, subject to revisions, or may not capture the entirety of the market. SPi makes no representation or warranty, express or implied, as to the accuracy, completeness, or timeliness of the information.
General Disclaimer
This document is provided for informational purposes only and does not constitute investment advice, an offer, or a recommendation to buy or sell any financial instrument or to adopt any investment strategy. The views expressed are those of SPi at the date of publication and are subject to change without notice. Past performance is not indicative of future results.
SPi accepts no liability for any loss arising from the use of this report or its contents.


