
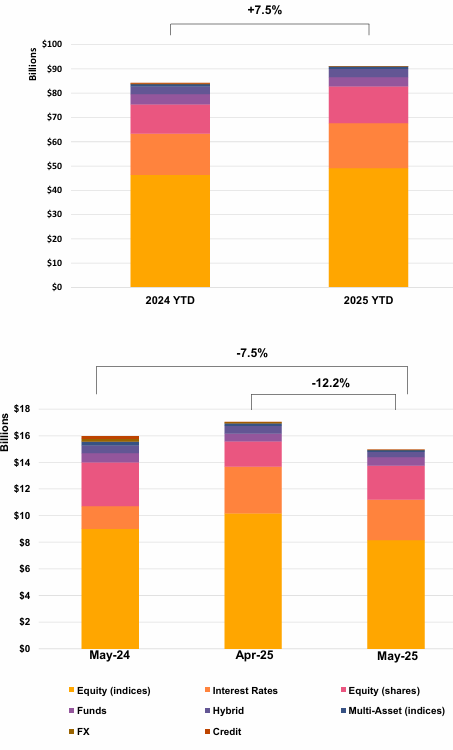
YTD Issuance Reaches USD 91.3Bn (+7.5% YoY) Despite Post-Q1 Slowdown and Softer May Volumes (USD 14.9Bn, -7.5% YoY)
Key Highlights
• Income Products: Volumes declined to USD 3.8Bn (-18% MoM), with market share dropping to 25.4% (vs. 40.4% peak in January), indicating reduced demand for income strategies.
• Underlying Mix: Equity indices dominate at 53.8% YTD, followed by rates (20.3%) and single stocks (16.6%), reflecting continued preference for broad market exposure.
• Payoff Preferences: Barrier phoenix remains leading (25.6%), followed by fixed rate (19.7%), despite the broader slowdown in income products.
• Risk & Structuring: Knock-in products account for 41.6% YTD (down from 44.2% YoY); average barrier levels normalized to 65.4% after peaking near 67%.
• Structure Mix: Single underlyings stable, while worst-of structures saw the sharpest decline (-36.7% MoM), signalling reduced appetite for correlation risk.
Market Overview
The latest data points to a moderation in structured product issuance following a strong Q1, with YTD volumes still reaching USD 91.3Bn (+7.5% YoY) despite softer activity in May (USD 14.9Bn, -7.5% YoY). The most notable shift is the sharp decline in income products, both in volume (USD 3.8Bn, -18% MoM) and market share (25.4% vs. 40.4% in January), suggesting a cooling in demand for yield-heavy strategies. This is further reinforced by the significant drop in worst-of structures (-36.7% MoM) and a slight reduction in knock-in product share (41.6% YTD), indicating a more cautious stance on correlation and downside risk selling. However, core market pillars remain intact, with equity indices (53.8%) continuing to anchor issuance and barrier phoenix structures (25.6%) maintaining their leading position. The normalization of knock-in barrier levels (65.4%) also points to a return to more balanced risk calibration. Overall, the market reflects a transition phase, with investors scaling back aggressive yield strategies while maintaining exposure through more selective and standardized structures.
Methodology & Notes
This report is based on SPi’s proprietary database of structured products distributed in the US. Figures reflect best-effort estimates based on available market data at the time of publication.
Disclaimers
Data Disclaimer (Best Effort / Completeness)
The information presented in this report is based on data collected from a variety of public and proprietary sources. While reasonable care has been taken to ensure accuracy, the data may be incomplete, subject to revisions, or may not capture the entirety of the market. SPi makes no representation or warranty, express or implied, as to the accuracy, completeness, or timeliness of the information.
General Disclaimer
This document is provided for informational purposes only and does not constitute investment advice, an offer, or a recommendation to buy or sell any financial instrument or to adopt any investment strategy. The views expressed are those of SPi at the date of publication and are subject to change without notice. Past performance is not indicative of future results.
SPi accepts no liability for any loss arising from the use of this report or its contents.


