
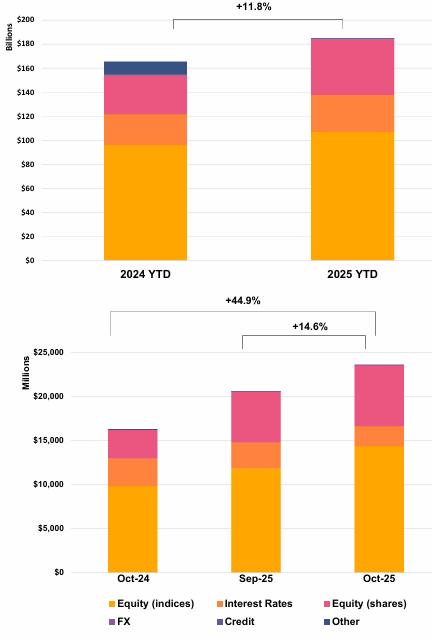
US YTD Issuance Reaches USD 184.7Bn (+11.8% YoY) as October Hits Record USD 23.6Bn (+44.9% YoY)
Key Highlights
• Product Mix: Growth products lead with 40.4% share, followed by Income (37.8%); Income structures regained monthly leadership, with the gap widening to USD 3.0Bn in October (vs. USD 1.8Bn in September).
• Structure Trends: Worst-of structures recorded their strongest month; volumes nearly matched single-underlying deals (~USD 10Bn each), indicating a sharp rebound in correlation exposure.
• Payoff Preferences: Barrier phoenix (30.3%) and fixed rate (16.0%) remain dominant; Barrier Participation leads within Growth at 5.5% YTD. Non-barrier phoenix payoffs overtook barrier digitals (USD 8.28Bn vs. USD 8Bn YTD).
• Underlying Mix: Equity indices dominate (57.9%), followed by single stocks (25.0%) and rates (16.6%), with indices up USD 11Bn YoY in absolute terms.
• Risk & Structuring: Knock-in products represent 47.8% YTD, with average barrier levels stable at 65.5%, reflecting consistent risk calibration.
Market Overview
October marks a turning point in US structured product issuance, with volumes reaching a record USD 23.6Bn (+44.9% YoY) and pushing year-to-date issuance to USD 184.7Bn (+11.8% YoY), firmly on track to exceed USD 220Bn for the year. The surge reflects broad-based strength across product categories, with Income structures regaining leadership and widening their lead over Growth products, signaling a renewed focus on yield generation. At the same time, the sharp rebound in worst-of structures, now nearly matching single-underlying volumes (~USD 10Bn each), points to a significant re-engagement in correlation risk. Structurally, the market remains anchored by barrier phoenix payoffs (30.3%) and elevated knock-in penetration (47.8%), underscoring sustained demand for yield-enhancing strategies. The overtaking of non-barrier phoenix over barrier digitals further highlights evolving preferences within income structures. Meanwhile, the continued dominance of equity indices (57.9%), combined with rising absolute volumes, reinforces the equity-driven nature of issuance. Overall, October confirms a strong acceleration phase, characterized by record issuance, increased risk appetite, and robust demand for income-oriented products.
Methodology & Notes
This report is based on SPi’s proprietary database of structured products distributed in the US. Figures reflect best-effort estimates based on available market data at the time of publication.
Disclaimers
Data Disclaimer (Best Effort / Completeness)
The information presented in this report is based on data collected from a variety of public and proprietary sources. While reasonable care has been taken to ensure accuracy, the data may be incomplete, subject to revisions, or may not capture the entirety of the market. SPi makes no representation or warranty, express or implied, as to the accuracy, completeness, or timeliness of the information.
General Disclaimer
This document is provided for informational purposes only and does not constitute investment advice, an offer, or a recommendation to buy or sell any financial instrument or to adopt any investment strategy. The views expressed are those of SPi at the date of publication and are subject to change without notice. Past performance is not indicative of future results.
SPi accepts no liability for any loss arising from the use of this report or its contents.


