Why one collateral category fails, and an empirically informed starting point for dynamic haircuts on autocallable barrier notes
Data: SPI daily EOD prices and SPI lifecycle data on US structured notes, January 2022 to June 2025
November 2026
1. Summary
A structured note’s risk as collateral is not fixed. It depends on how far the worst-performing underlying is from the barrier. Far from the barrier, an autocallable barrier note behaves much like a bond. Close to it, the note behaves like the equity it is linked to.
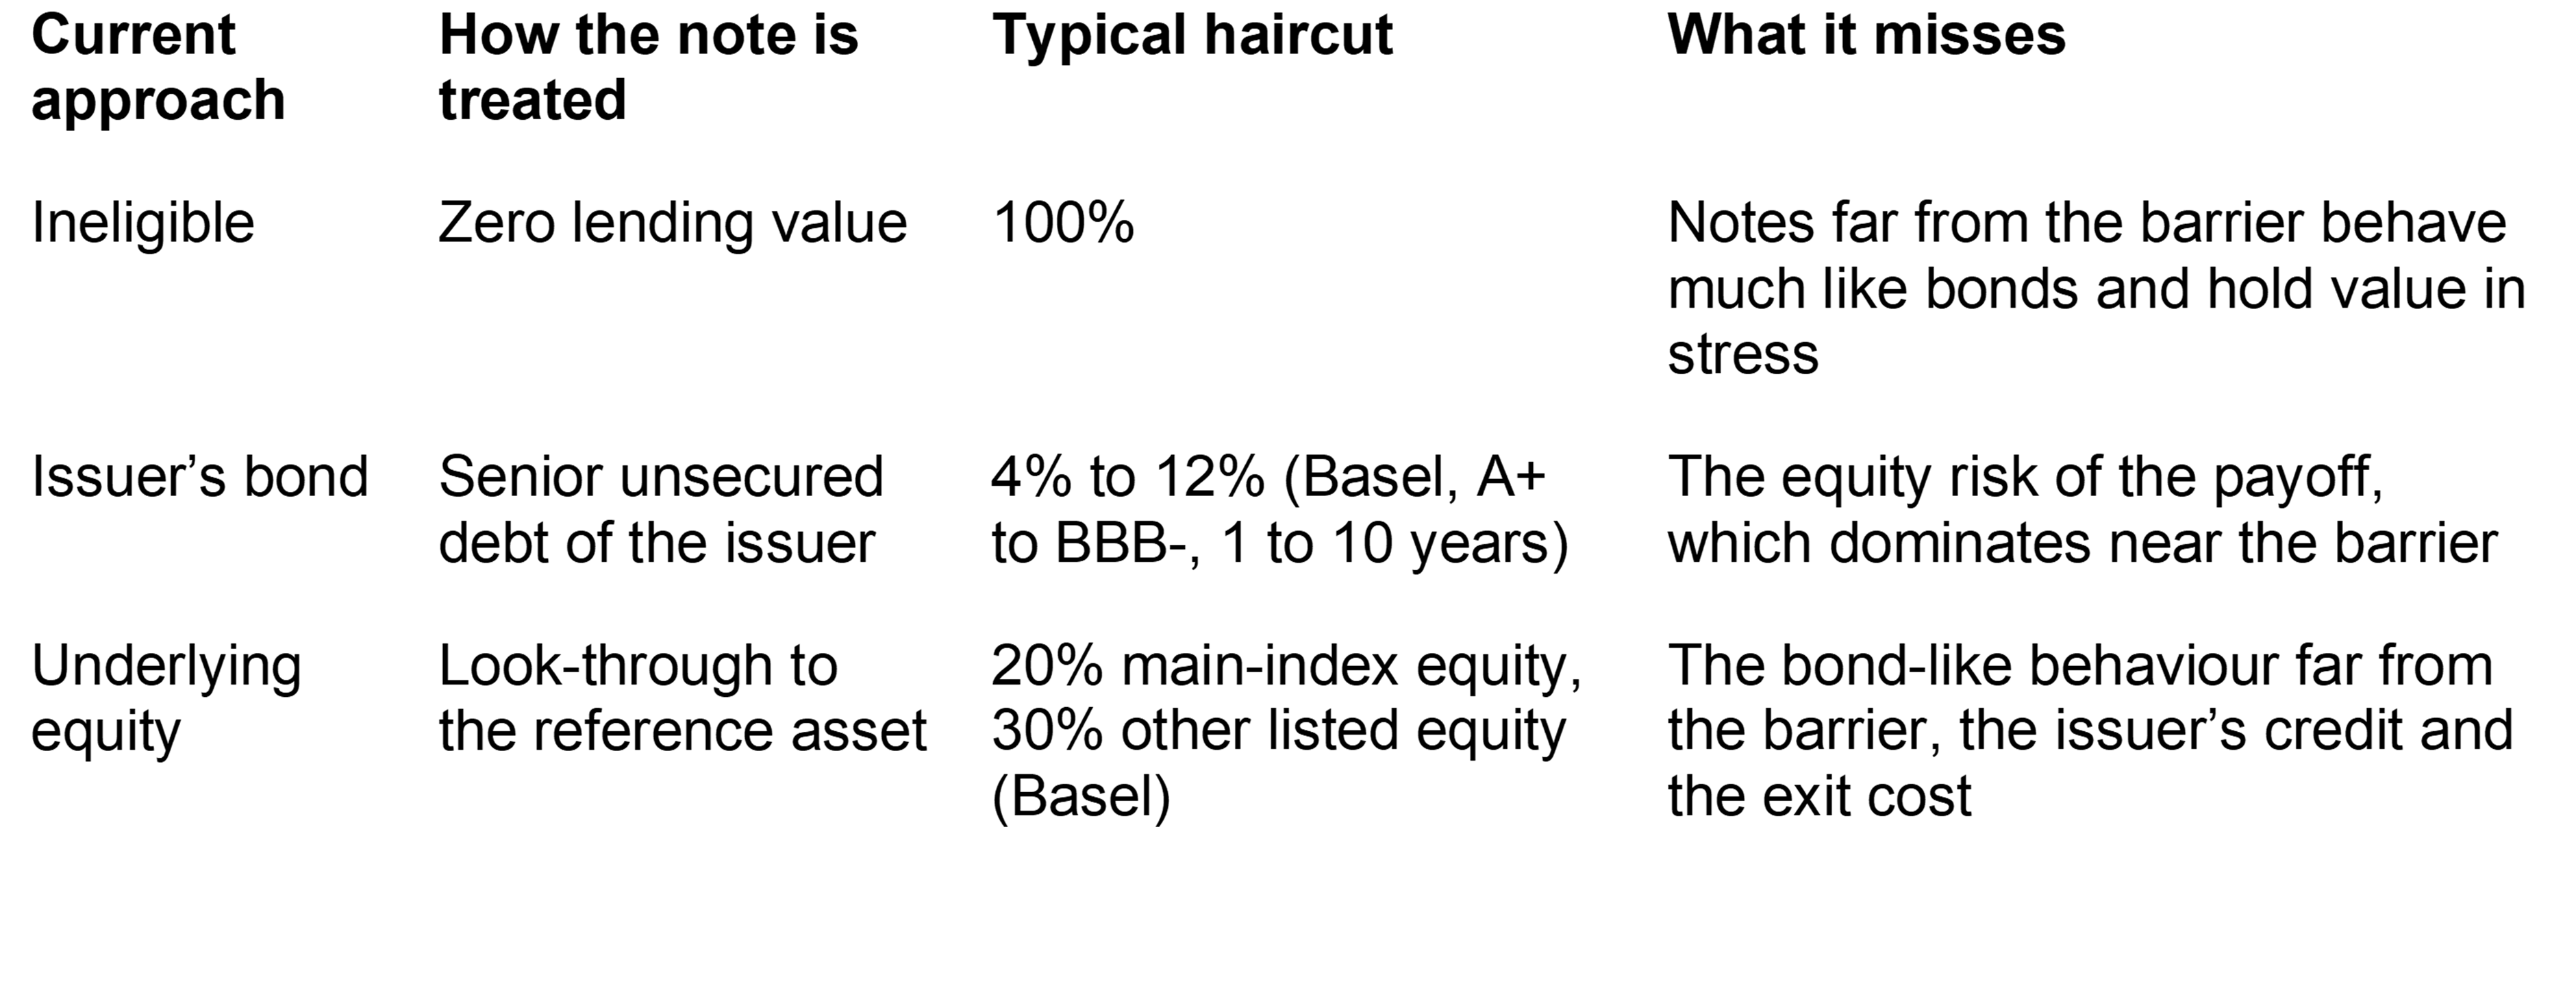
Most lenders today treat structured notes in one of three static ways: as ineligible, as the issuer’s unsecured debt, or as the underlying equity. Each misprices the risk. They lend too little against notes that still behave like bonds, and too much against notes that have turned into equity.
Using SPI daily bids and lifecycle data on 263 autocallable barrier notes from 20 issuers, 2022 to 2025, we find:
- Notes switch from bond-like to equity-like as they approach the barrier. Far from the barrier, a note’s bid moves about 0.1 point for each point the worst-of underlying moves. Within 15% of the barrier it moves one-for-one.
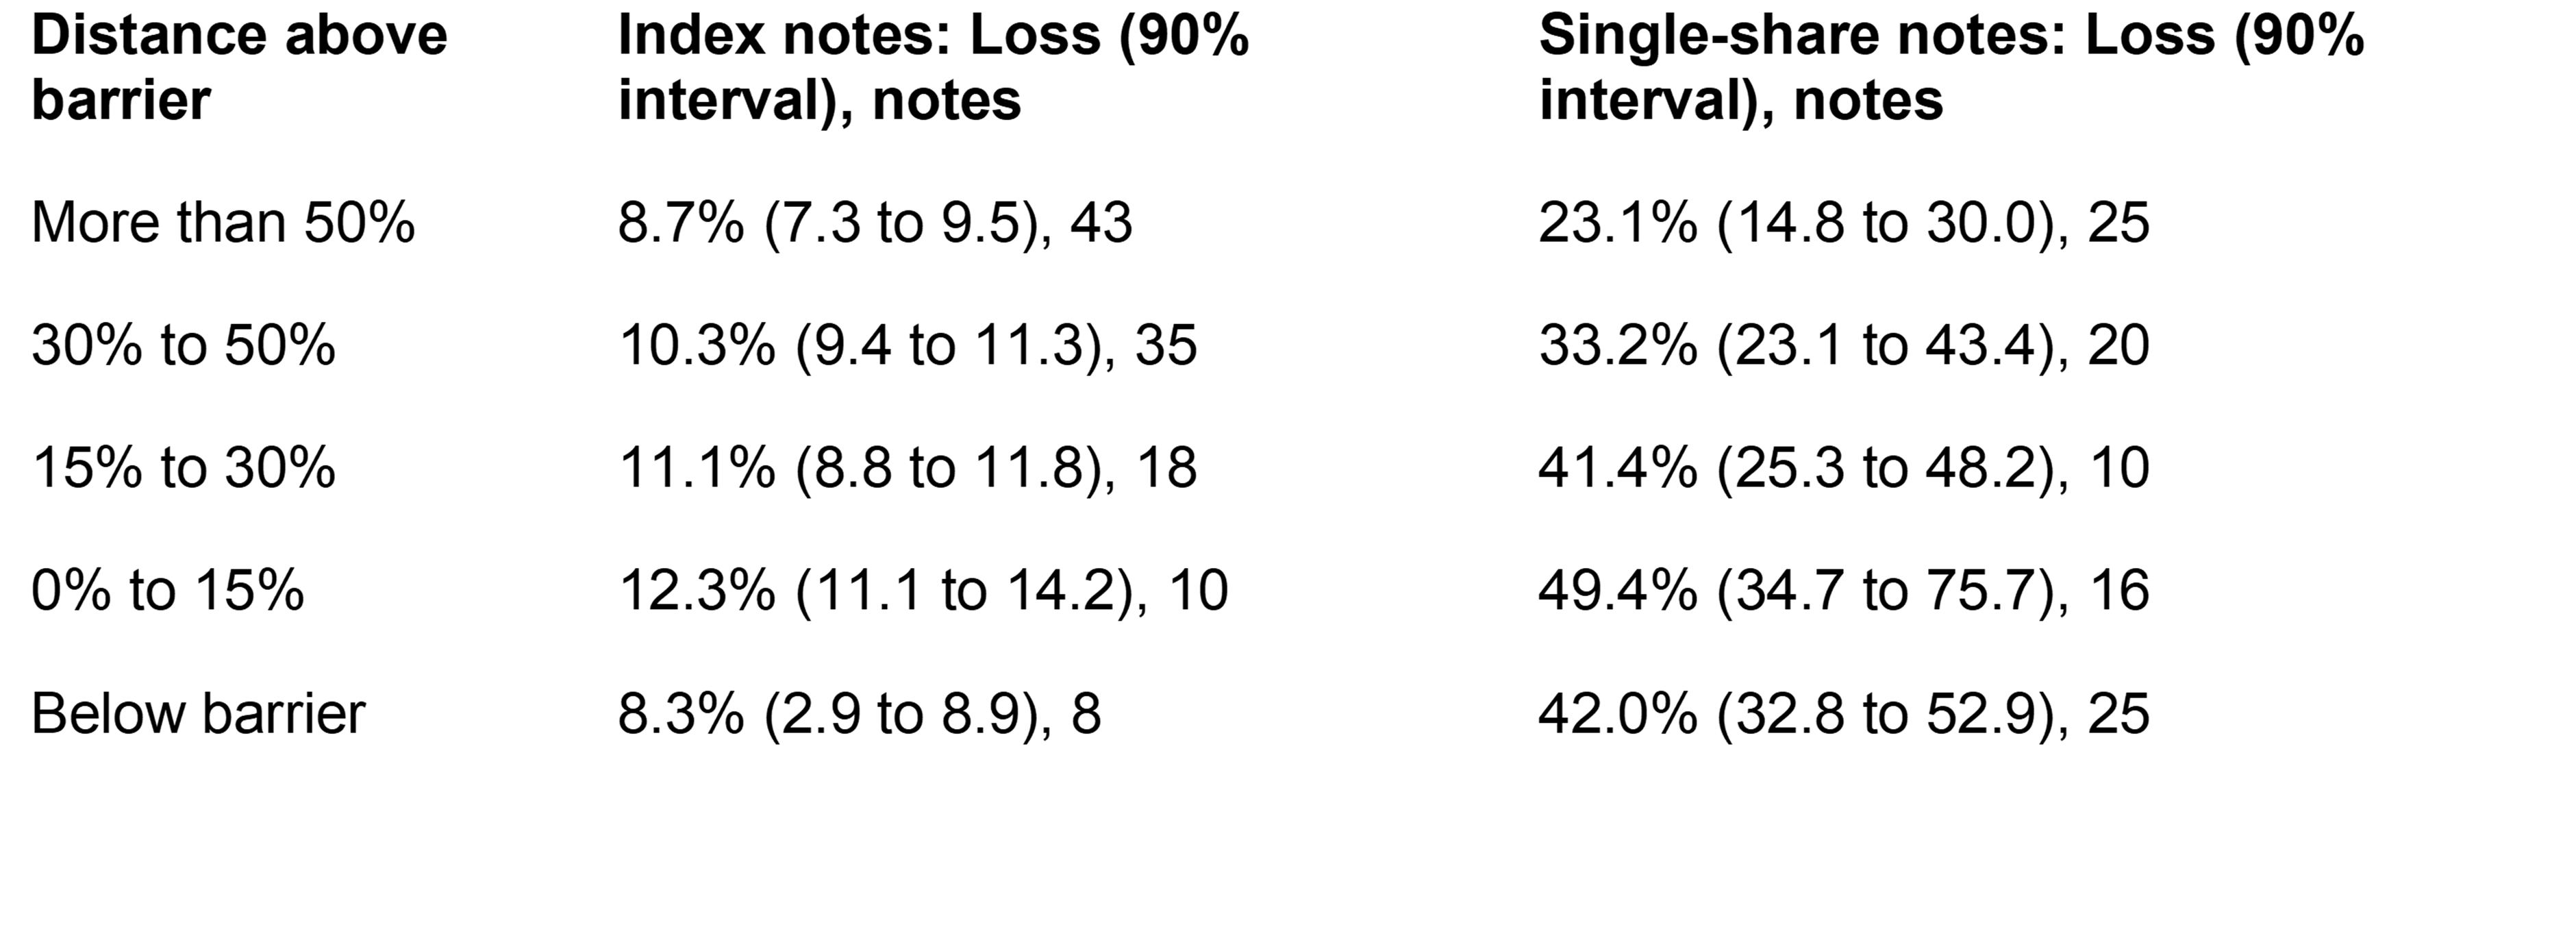
- For single-share notes, distance to the barrier drives the risk. In a stressed fortnight, the 99th-percentile loss on single-share notes roughly doubles, from about 23% far from the barrier to about 50% close to it. On index notes it rises less, from about 9% to 12%, a range similar to the variation by term.
- Issuer stress adds a separate, short-lived discount. In March 2023, Credit Suisse notes were marked 19 points below otherwise identical notes from other issuers. The gap closed within two weeks of the UBS takeover.
The consequence is concrete. On a $1 million portfolio holding $700,000 of autocallable notes, treating the notes as issuer bonds still lends $775,000 when the underlyings are within 15% of their barriers: about $120,000 more than the stress losses in our data support, although the near-barrier estimates rest on small samples.
We propose dynamic, risk-based collateral valuation: haircuts set by underlying type and distance to barrier, refreshed as the note moves. The framework is a starting point for lenders to calibrate, not a finished haircut schedule.
2. The collateral problem
Structured notes are a large share of many US wealth portfolios, and securities-based lending against those portfolios has grown. Yet lenders have no common view of what a structured note is worth as collateral.
Source: SP Intelligence, part of WSD.
What regulation says. The Basel framework does not name structured notes. Its supervisory haircuts for the comprehensive approach, set for a 10-business-day holding period with daily remargining, are 20% for main-index equities, 30% for other listed equities, and 4% to 12% for A+ to BBB- rated non-sovereign debt with one to ten years to maturity (CRE22.49). That horizon applies to capital-market transactions, including margin lending. For secured lending, which can include Lombard and securities-based credit lines, the minimum holding period is 20 business days, and the haircuts scale up by the square root of time, about 1.4 times. Depending on how a bank classifies a note, its haircut can land anywhere from 4% to 100%. Securities issued by the borrower or a related entity are ineligible (CRE22.7). Collateral that is not remargined daily, or is valued by models with unobserved inputs, requires a 20-business-day holding period (CRE22.57 and 22.58).
The FINRA precedent. In 2019 FINRA excluded exchange-traded notes from the reduced margin available to investment grade debt and set strategy-based margin at 25% of market value (Regulatory Notice 19-21), on the grounds that the reference index matters more than the note’s legal form. It is the clearest regulatory statement that a note should be margined by its payoff rather than its wrapper. It does not cover unlisted structured notes and applies one rate regardless of how the payoff is positioned.
What lenders do in practice. Swiss private banks, among the most active Lombard lenders against structured products, described a look-through approach to us. Lending value comes from the loan-to-value of the underlying, and eligibility depends on the issuer’s rating, the remaining tenor and a daily issuer secondary market, with fixed thresholds triggering the largest haircut steps. Practice varies. Lenders that revalue notes with full pricing models may already capture part of the barrier effect internally. What is missing is a public, data-based benchmark for how a note’s haircut should change as it approaches the barrier. This paper provides one.
Five sources of risk. A note’s collateral value is exposed to the market risk of its payoff, the issuer’s credit, exit liquidity, valuation uncertainty and wrong-way risk. Equities and bonds each carry some of these; a structured note carries all five, and the mix changes over its life. This paper measures the first directly and the second through the Credit Suisse case. The other three are built into the framework as adjustments and controls but are not yet measured.
3. Data and measure
Sample. From SPI data on 379,492 US structured products, we selected autocallable contingent-coupon notes with a knock-in put, the most common US payoff family, on broad equity indices or single stocks, live through one or more of four stress windows. 263 notes from 20 issuers had usable daily bids: about 148,000 observations from January 2022 to June 2025. For 133 of them, SPI lifecycle records also give the worst-of level at each coupon and call observation date. Nearly all observe the barrier only at maturity.
One measure. Every comparison uses the 99th-percentile loss over two weeks in four stress windows: the 2022 drawdown, the March 2023 SVB and Credit Suisse crisis, the August 2024 yen carry unwind and the April 2025 tariff sell-off. Two weeks is the nearest weekly match to Basel’s 10-business-day horizon. Where a facility counts as secured lending, Basel’s horizon is 20 business days; Section 5 reports four-week losses for that case. Benchmarks are weekly total returns on SPY, IWM and LQD. Credit Suisse notes are excluded from market-risk measures and analysed separately.
Distance to barrier. Each two-week window is placed by the worst-of’s distance above the barrier at its start.
Indicative bids. Every note price is the issuer’s daily indicative bid. It is the best available daily valuation but not an executable price: the issuer is usually the only buyer and can widen its bid or step away in stress. The losses reported are therefore losses in marked value, and a lower bound on losses in a forced sale.
Sample selection, data checks, issuer coverage and the precision of the estimates are set out in Appendix A.
4. Findings
4.1 How structured notes behave in stress
Measured the same way, index notes lose 10.5% in a stressed fortnight at the 99th percentile, the same as the S&P 500. Single-share notes lose 37.0%, more than three times as much. Investment grade bonds lose 4.6%, under half of what index notes do.
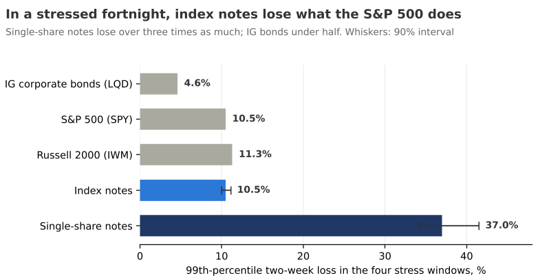
Source: SP Intelligence, part of WSD. 211 notes from 19 issuers, excluding Credit Suisse. Benchmarks: weekly total returns of SPY, IWM and LQD (ChartRow).
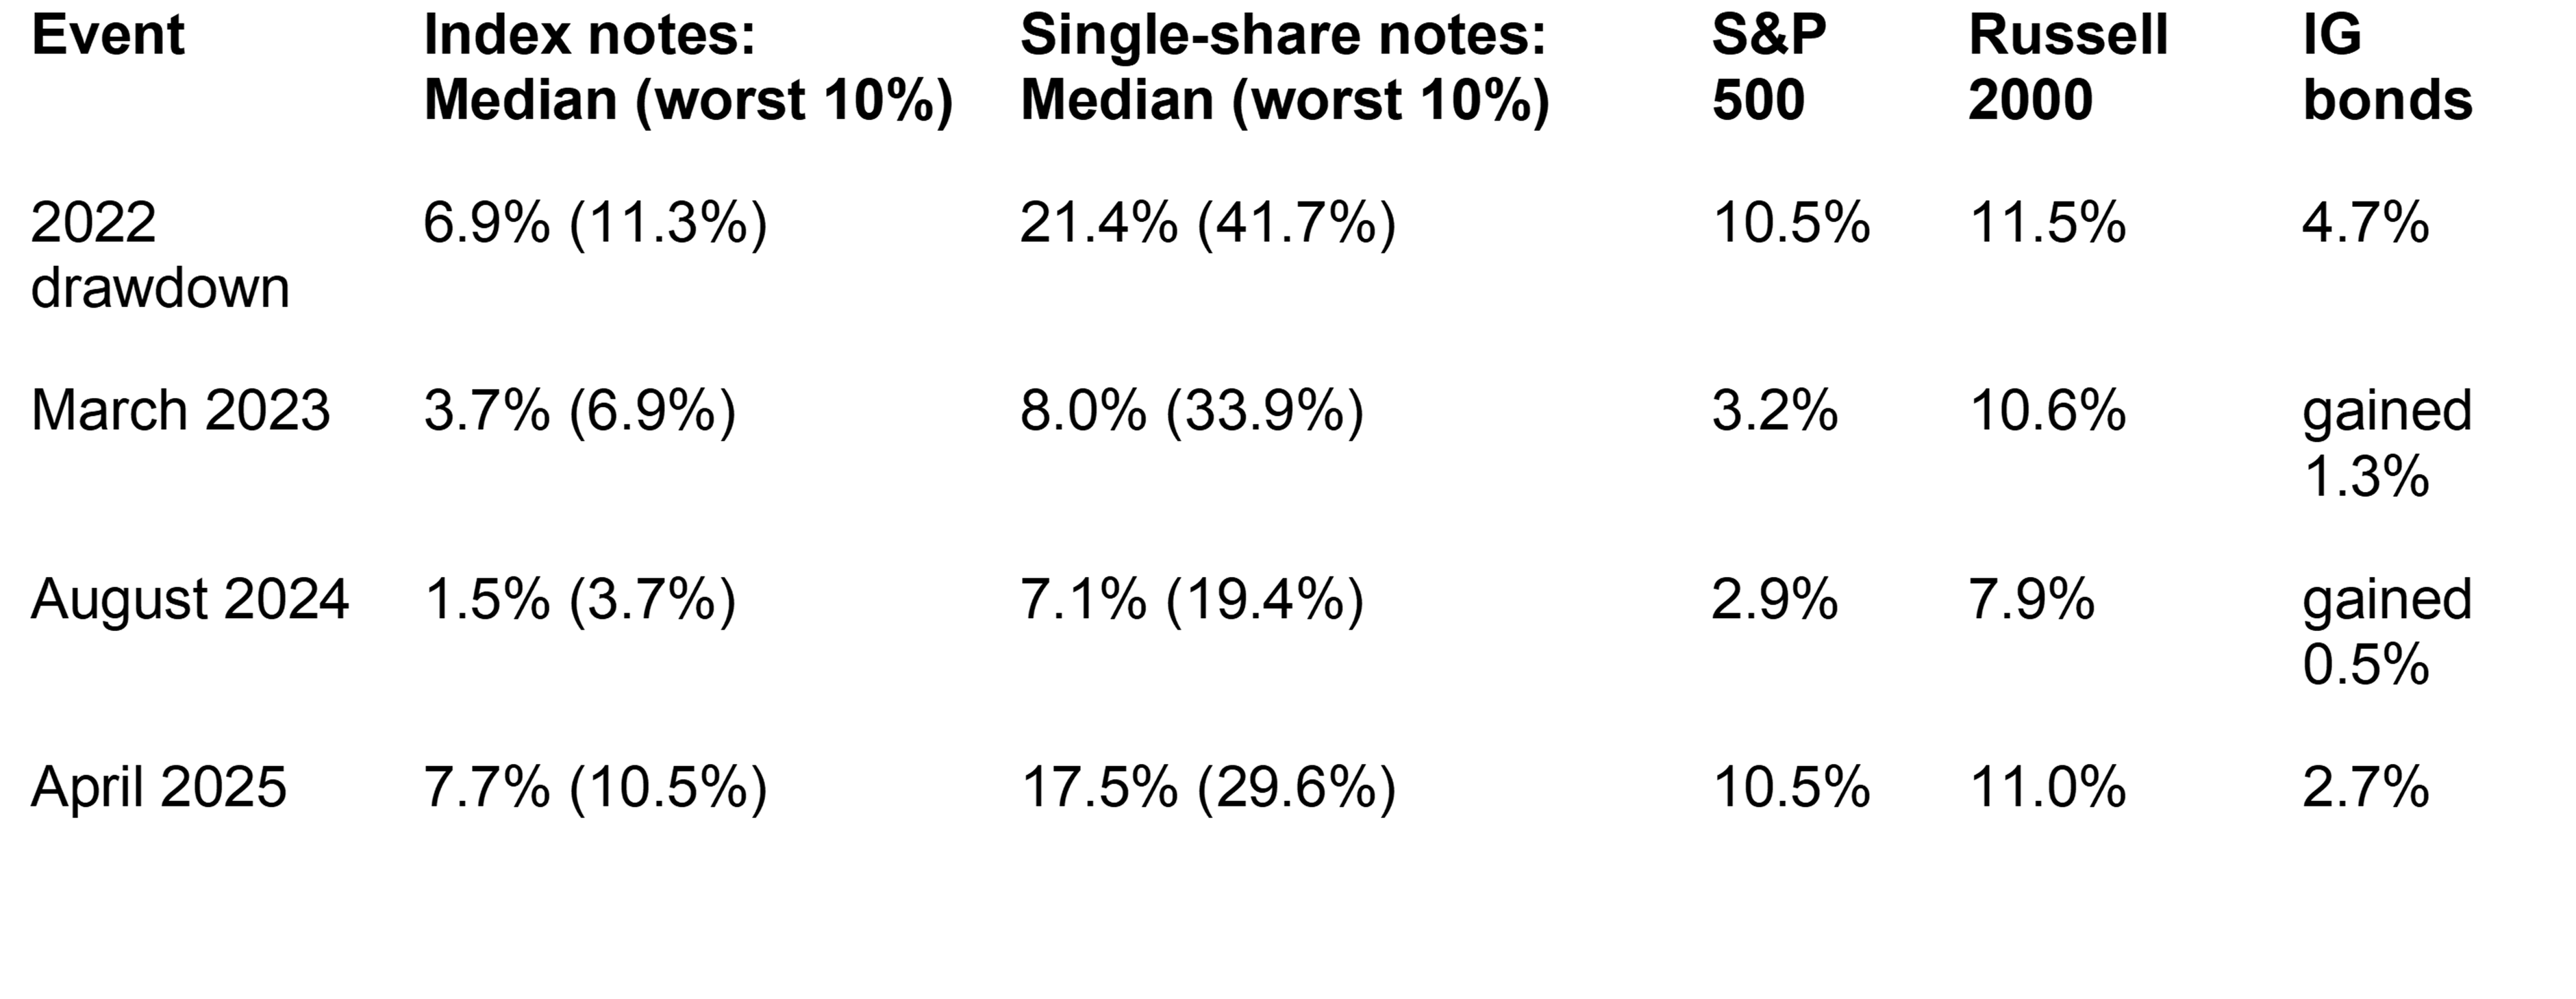
The median note did better than the benchmarks in most events; its tail did not. Each event tested something different (Appendix B):
- 2022, the slow drawdown. No single fortnight was extreme, but losses compounded through the year. The median index note fell 19% at its weekly low and the median single-share note 44%. Two-week haircuts protect a lender only if margin calls are enforced throughout.
- March 2023, the banking shock. The median index note barely moved, but the worst 10% of single-share notes lost a third of their value, driven by notes on bank stocks.
- August 2024, the volatility spike. The median note recovered within three weeks. The worst single-share losses came from company results in the same week: single-share haircuts must cover single-name events in any window.
- April 2025, the fast sell-off. The S&P 500 fell about 12% in four sessions. Index notes fell 8% and single-share notes 17%, and all index notes had recovered their pre-event bids within 120 days.
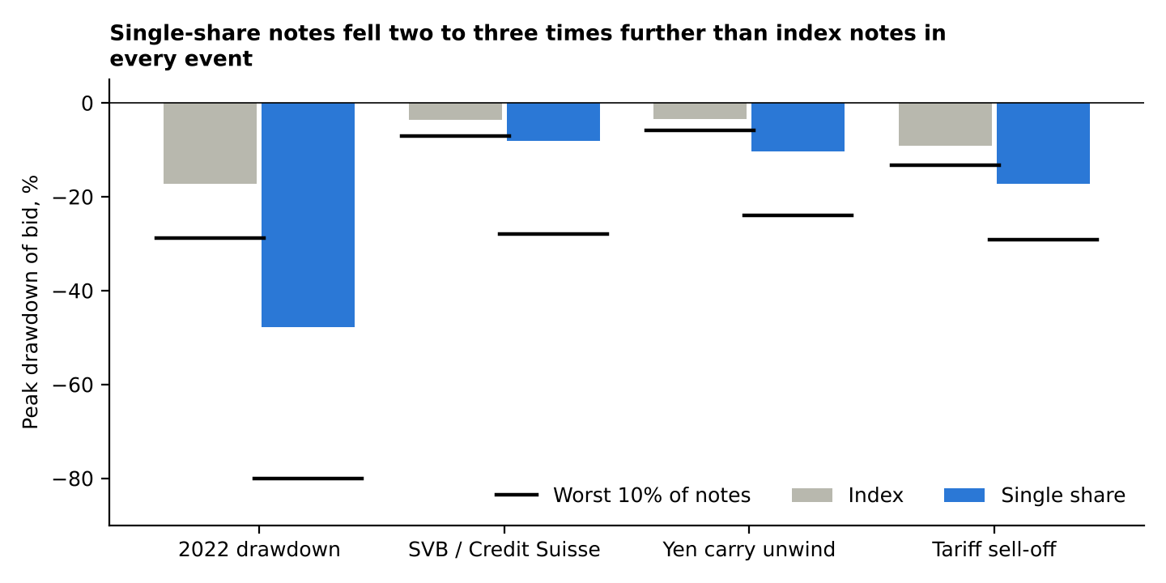
Source: SP Intelligence, part of WSD. Peak drawdown of bid in each window against the last bid before it (daily data). Bars: median note; tick: worst 10%.
4.2 The barrier effect
Between successive quarterly observation dates, we measured how far each note’s bid moved for each point the worst-of moved, grouped by distance to barrier.
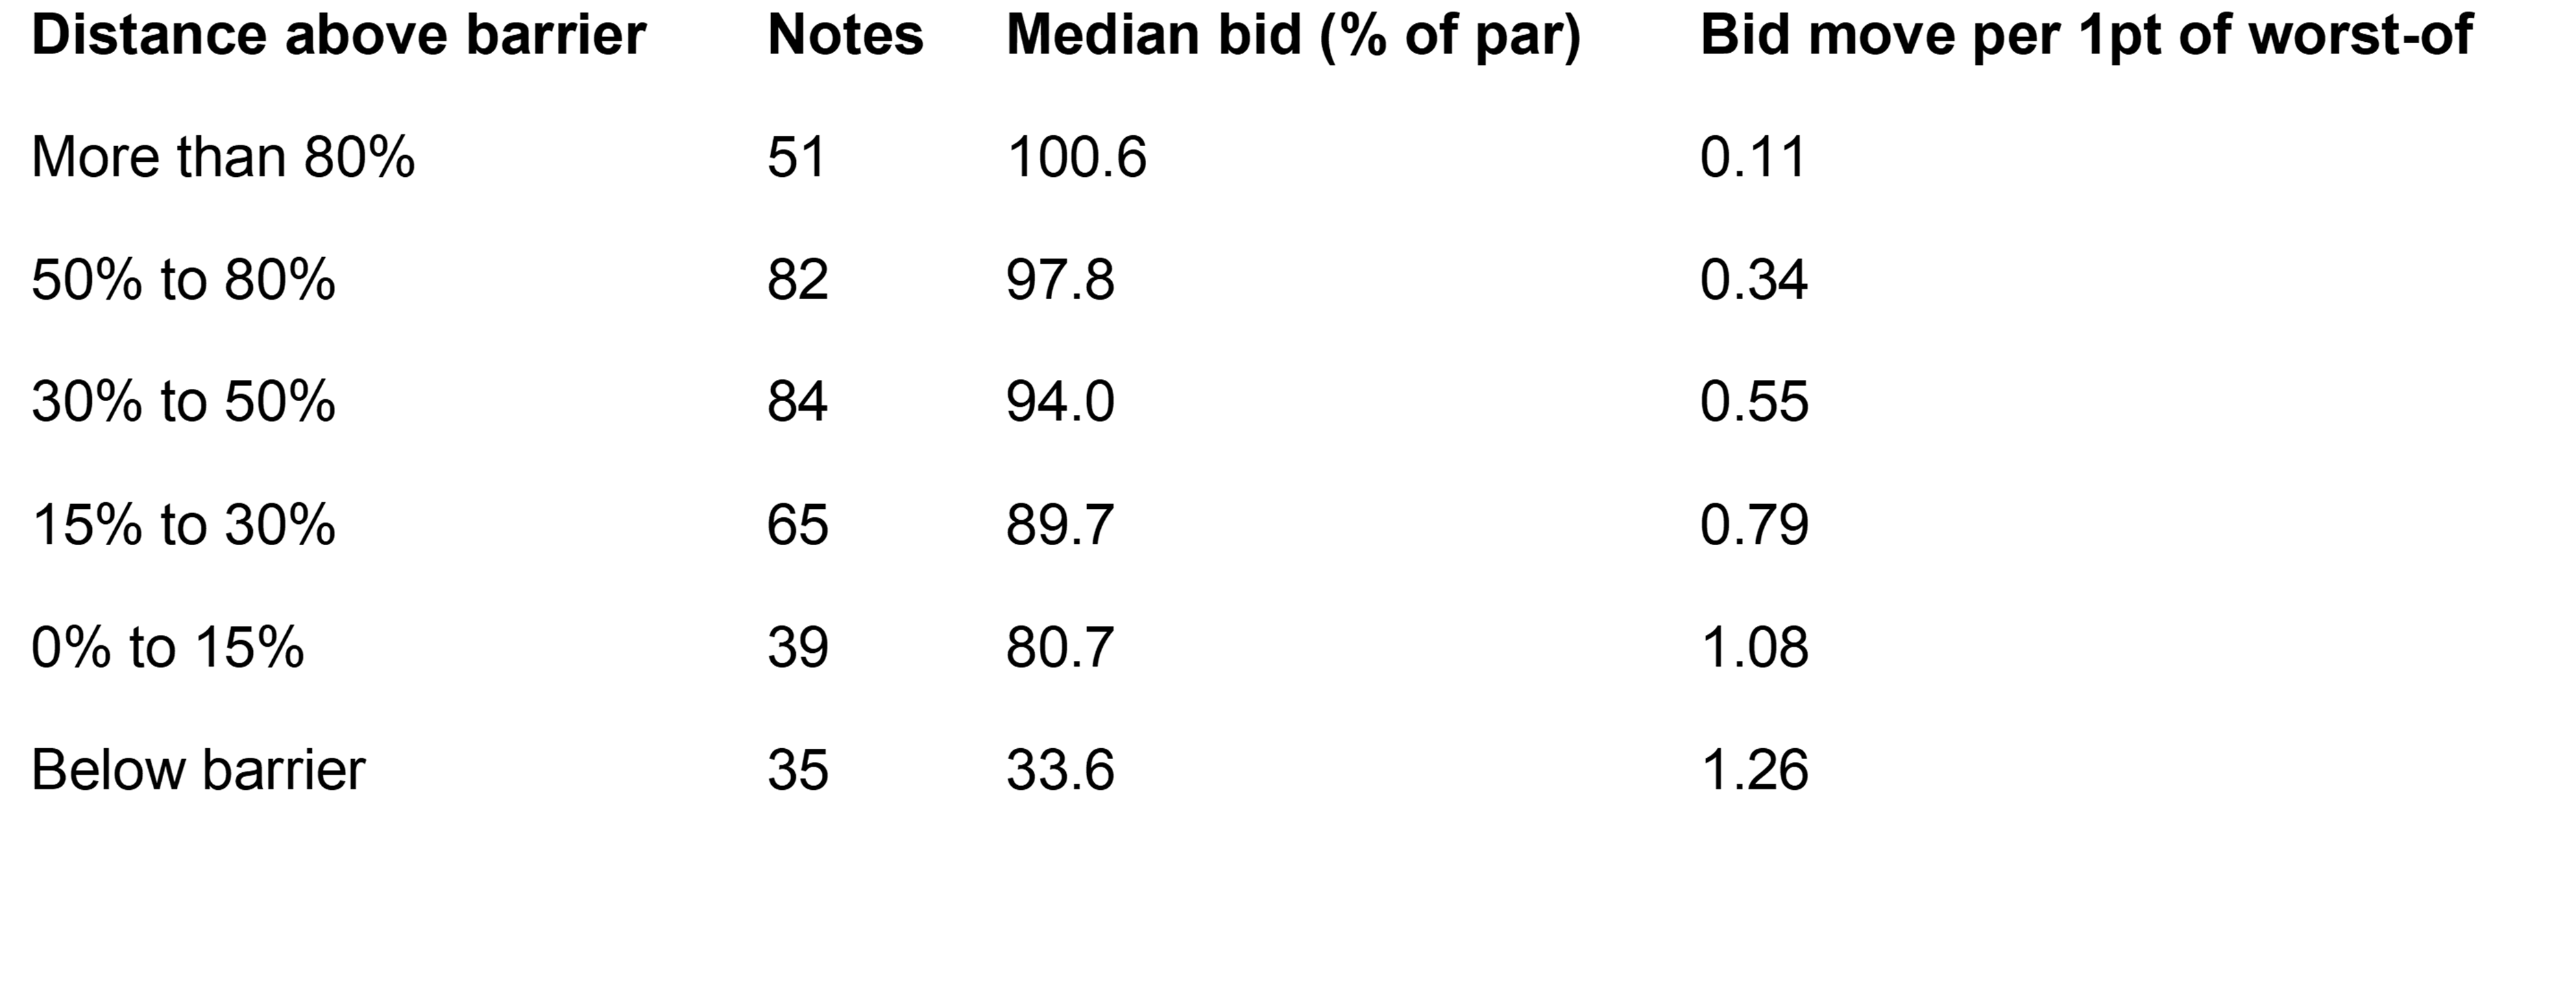
Source: SP Intelligence, part of WSD. 133 notes, 1,561 quarterly observations.
The switch is clear and gradual. Far from the barrier, notes are bond-like: the bid moves about a tenth of the underlying. Within 15% of the barrier they move one-for-one, and below it slightly more, because the bid also prices further falls before maturity. Index and single-share notes follow the same curve.
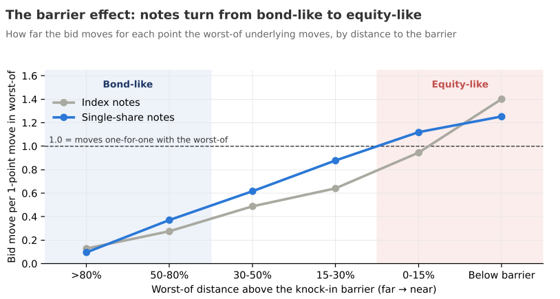
Source: SP Intelligence, part of WSD. 133 notes, quarterly coupon and call observations, October 2021 to September 2025.
The bid also shows how the market prices the barrier. Above it, the gap between the bid and par is the market’s price for barrier risk: about zero far from the barrier and 19 points within 15% of it. One bank-basket note shows both regimes. When its worst-of recovered above the barrier in January 2023, the payoff jumped to par but the bid only reached about 70: the market kept pricing a second breach. It came in March, and by May the bid was in single digits.
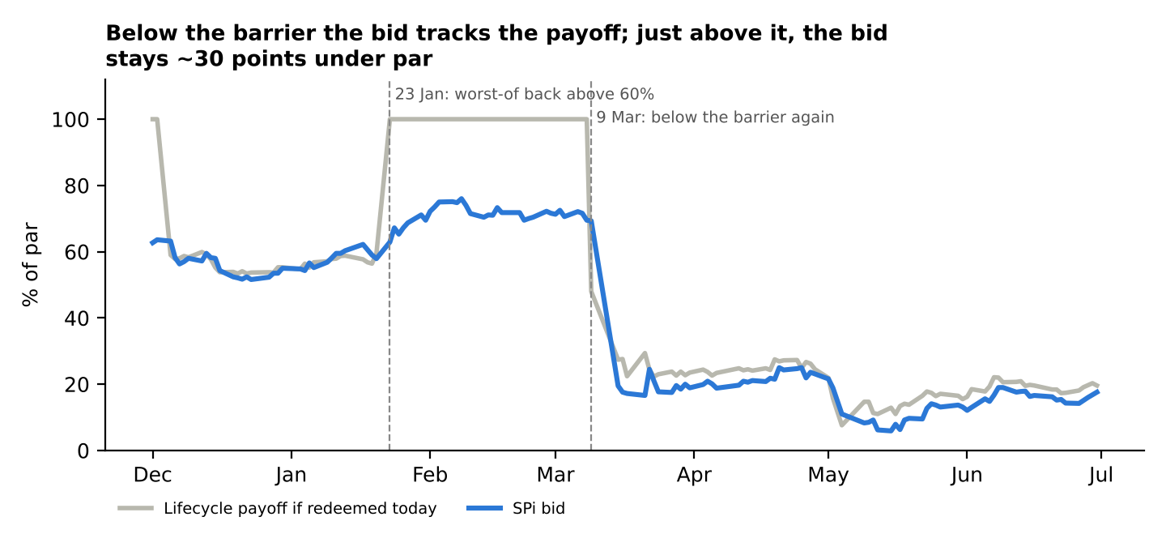
Source: SP Intelligence, part of WSD. One bank-basket note (worst-of Citigroup, Comerica and PacWest; 60% barrier at maturity), December 2022 to June 2023.
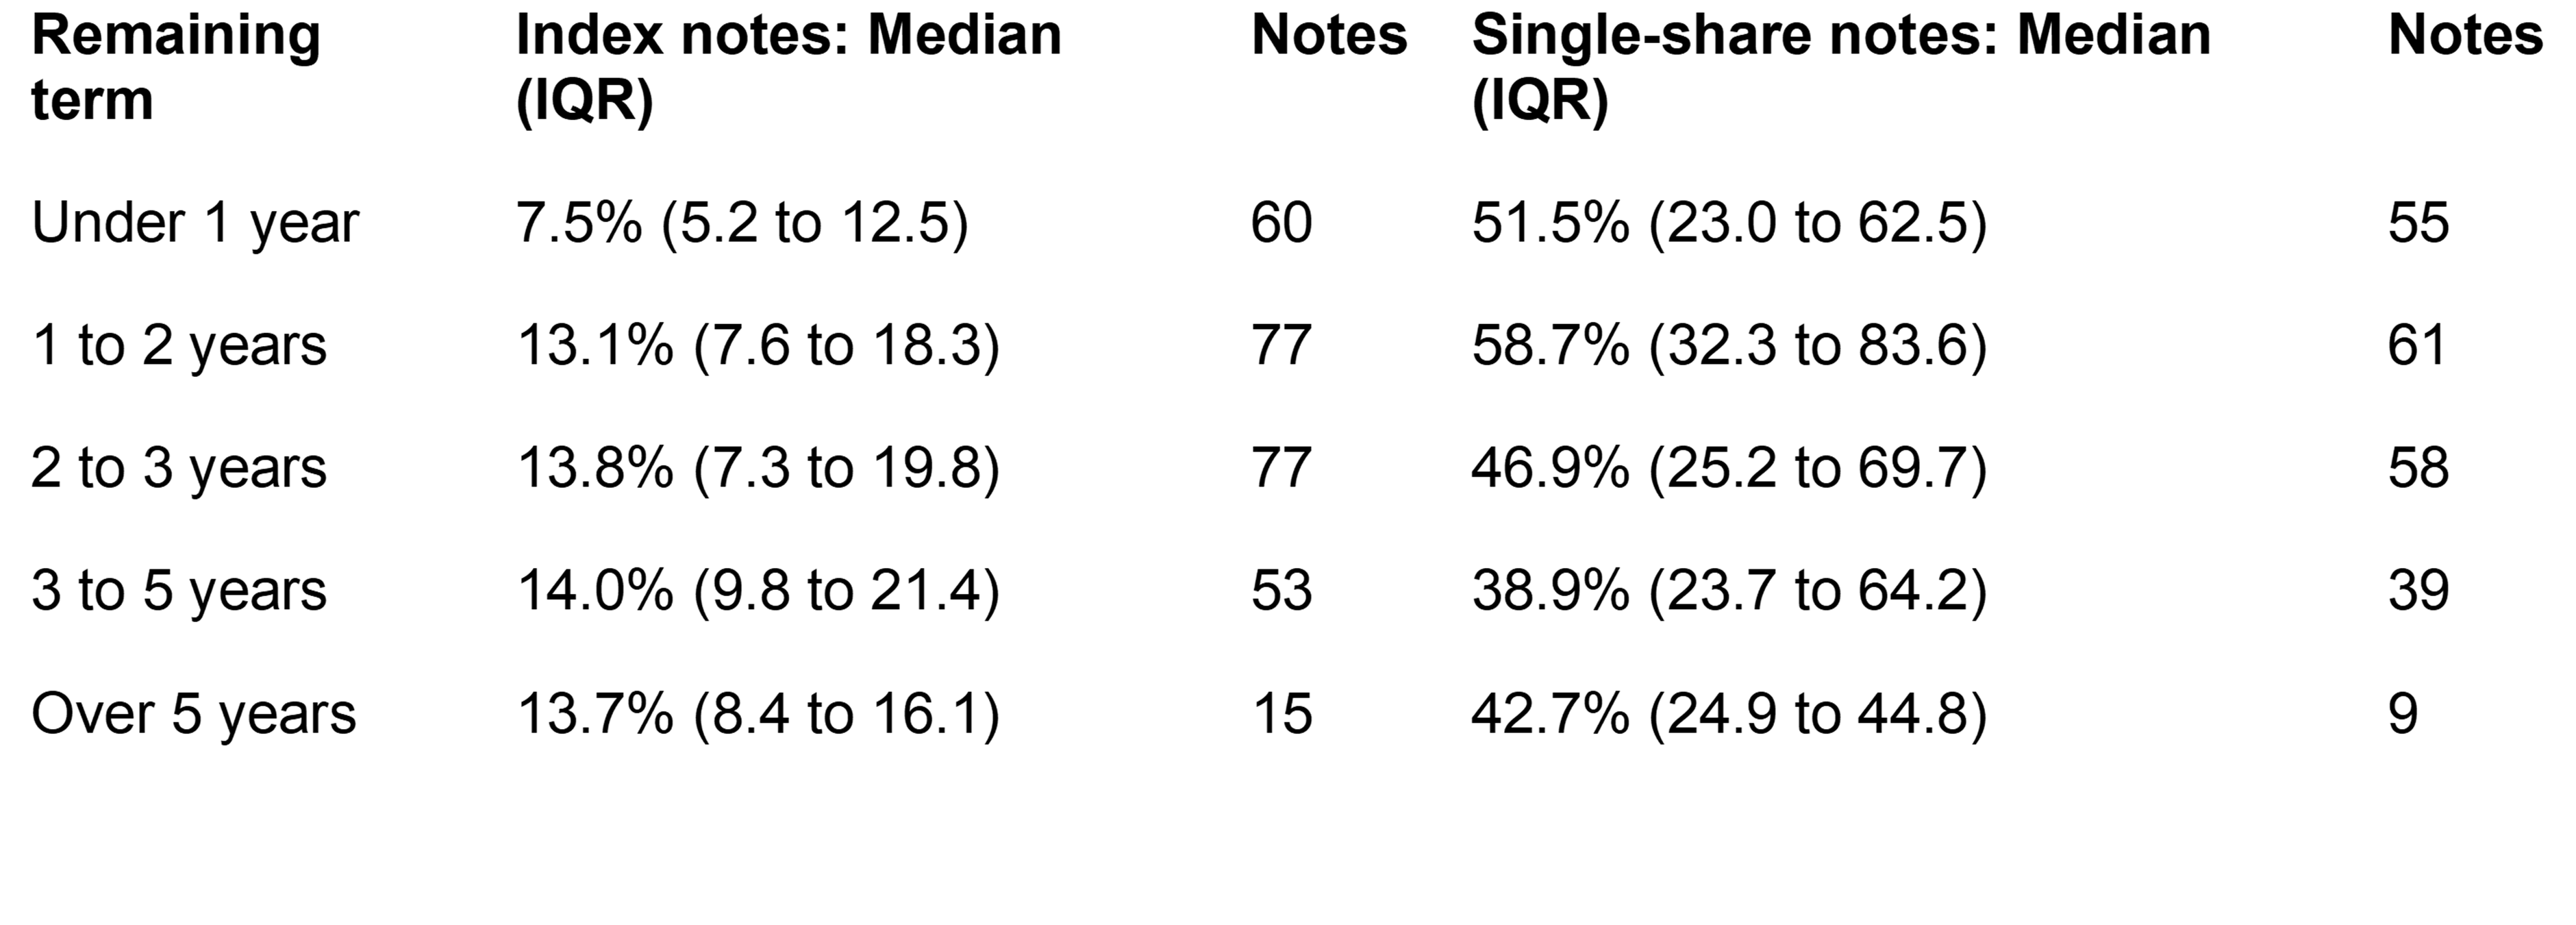
Distance matters more than term for single-share notes. By distance to barrier, the stress loss on single-share notes doubles, from 23% to 49%. By remaining term, their annualised bid volatility varies by about half, from 39% to 59% (Appendix C). For index notes the picture is less clear: bid volatility ranges from 7.5% under one year to about 14% beyond it, a spread similar to the 9% to 12% range in stress loss by distance. The two measures are not directly comparable, and splitting each distance bucket by term (Section 6) will test which dominates. For single-share notes, a collateral treatment that buckets by tenor misses most of the variation.
4.3 Issuer credit and wrong-way risk
To isolate issuer credit, we paired 20 Credit Suisse notes with notes from other issuers on the identical underlying set, a similar remaining term and a similar barrier, and tracked the gap between their bids.
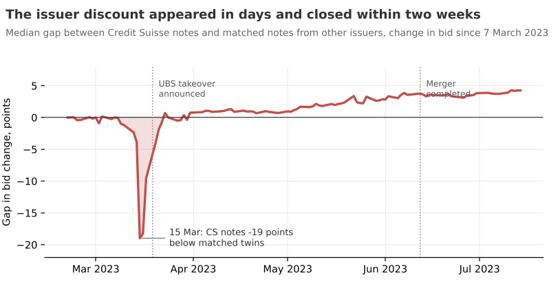
Source: SP Intelligence, part of WSD. Median gap, Credit Suisse note minus matched note from another issuer, change in bid since 7 March 2023, 20 pairs (daily data).
On 15 March 2023, Credit Suisse notes were down 24% against 3% for their matched twins: an issuer discount of 19 points. On the first trading day after the UBS takeover the gap had narrowed to 4 points, and by 31 March it had closed. The issuer component is real and large, briefly exceeding the market haircut for most index notes. It was also short-lived: a lender forced to sell on 15 March would have lost 19 extra points; one who held would have lost none. That argues for an issuer adjustment that switches on with issuer stress, not a permanent one.
Wrong-way risk also showed in the underlyings. In March 2023, the four single-share notes on all-bank baskets lost a median 55%, against 8% for the other 52 single-share notes. For a bank lender, collateral on bank stocks loses value exactly when its own funding is under strain.
5. A dynamic haircut framework
The framework sets a note’s haircut from a measured market component, plus adjustments and controls that lenders calibrate themselves. Only the market haircut is measured. The issuer stress adjustment is illustrative, based on one case. The liquidation adjustment is not calibrated. Wrong-way risk is handled by controls rather than a haircut. The framework is derived only from autocallable barrier notes and should not be applied to other structures until they are tested.
Market haircut. The measured stress loss is rounded up to the next five points, and never set lower than the haircut for the bucket further from the barrier.
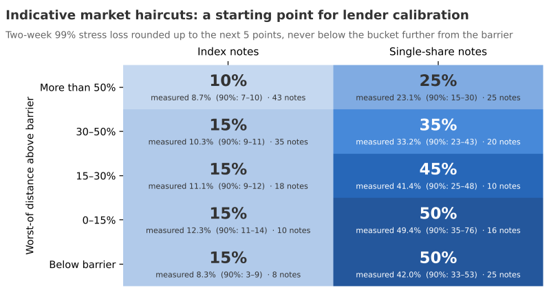
Source: SP Intelligence, part of WSD. 116 notes excluding Credit Suisse. Excludes issuer, liquidation and wrong-way adjustments.
Equity look-through doubles the haircut on index notes far from the barrier and understates the risk of single-share notes near it. Bond treatment understates every single-share position, by a factor of four or more near the barrier. The far-from-barrier rows are more reliable than the near-barrier ones, where cells are small and intervals wide.
A worked example. A client pledges a $1 million portfolio: $400,000 of index notes, $300,000 of single-share notes and $300,000 split equally between main-index equities and A-rated corporate bonds with three to five years to maturity. Notes are valued at the median SPI bid for each distance (within 15% of the barrier, about 84.5 for index notes and 69.8 for single-share notes); traditional assets are held constant at Basel haircuts (20% and 6%).
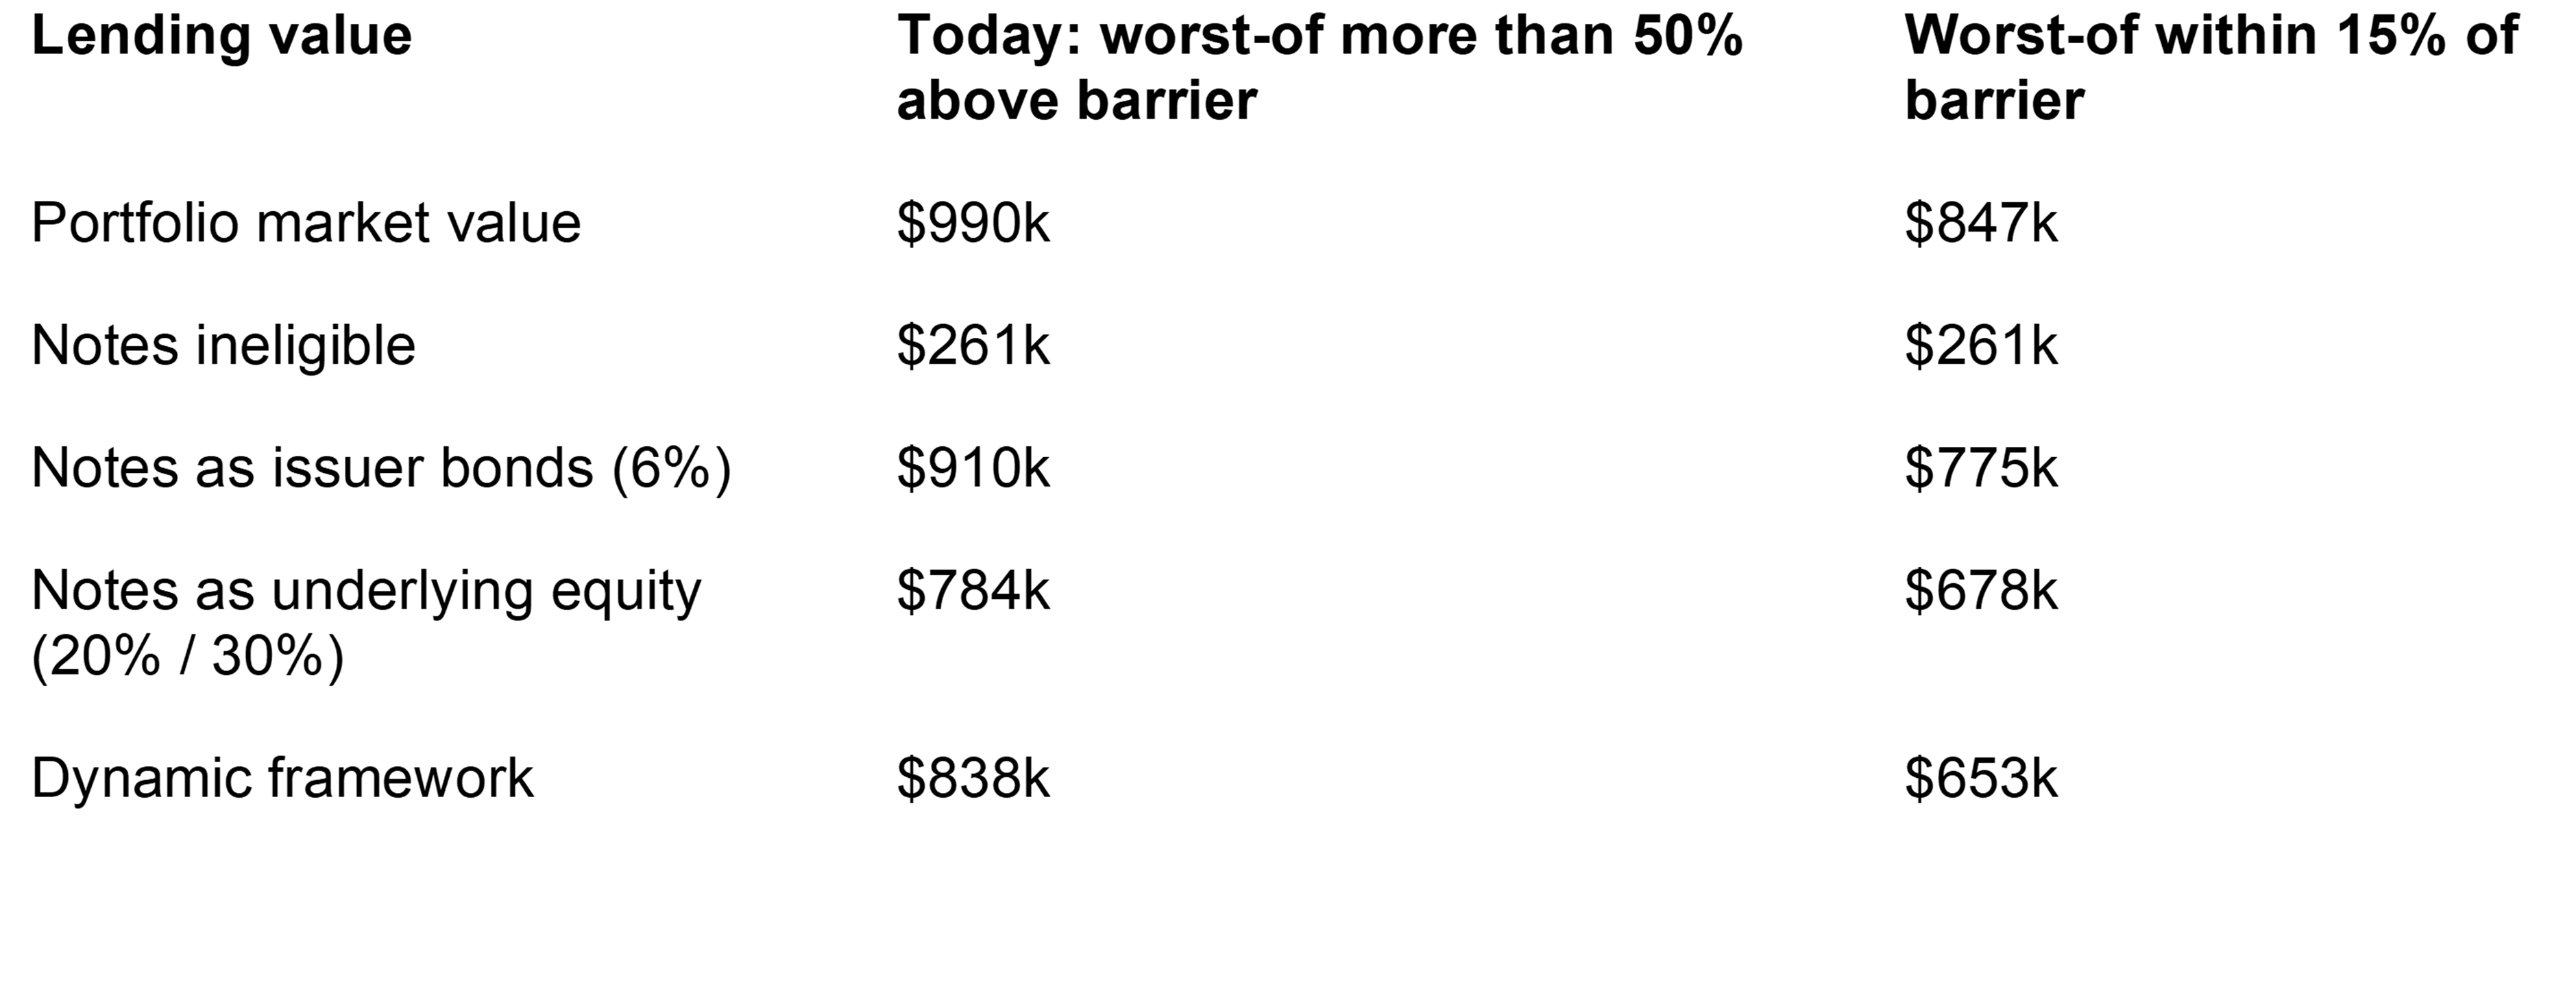
Source: SP Intelligence, part of WSD. Market haircuts only; issuer, liquidation and wrong-way adjustments excluded.
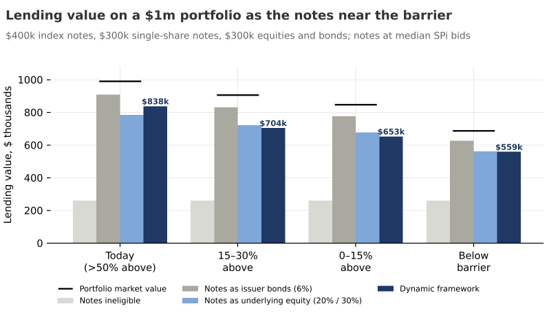
Source: SP Intelligence, part of WSD. Market haircuts only; traditional assets at Basel supervisory haircuts (20% main-index equity, 6% A-rated 3 to 5 year bonds), held constant.
Today, the framework lends $54,000 more than equity look-through, because the notes still behave much like bonds. As the underlyings approach the barrier, it cuts lending value faster than either static approach. Bond treatment then lends $122,000 more than the framework: lending that the stress losses in our data do not support.
Adjustments and controls.
- Issuer stress. A note issued by the lender or a related entity is ineligible, as Basel already requires. Beyond that, a lender may add a conditional discount when an issuer is under stress, for example on a sharp widening of its credit spreads or a downgrade. The Credit Suisse case suggests about 20 points while the stress lasts; it is one rescued issuer, not a calibration.
- Liquidation. Basel sets a 20-business-day holding period for secured lending, and for collateral that is illiquid or valued by models. Over four weeks rather than two, the stress loss rises to 9% to 15% for index notes and 35% to 57% for single-share notes in most buckets. Lenders whose facilities count as secured lending should treat the four-week figures as their base market haircut. Until executable prices are measured, other lenders should apply the longer horizon or their own exit-cost estimate.
- Wrong-way risk. For bank lenders, a concentration limit or eligibility rule for notes whose underlyings are bank stocks.
6. Implications and limitations
For lenders. Replace a single structured-note category with a grid keyed to underlying type and distance to barrier, refreshed as the note moves, and recalibrate it on your own data. The input needed, the worst-of level against the barrier, is available daily from lifecycle data. Pair it with an issuer stress trigger and a liquidation horizon that reflects issuer-only liquidity.
For issuers. Daily, transparent marks and a dependable secondary market are what make a note usable as collateral. Issuers whose bids stay firm in stress make their notes more valuable to clients who borrow against them. Secured note structures, which separate collateral value from issuer credit, go further.
For advisers. Pledgeability is part of suitability. A client who expects to borrow against a portfolio should know that the lending value of a single-share note can fall from three quarters of its value to half as the underlying approaches the barrier, and that a lender may reprice it at exactly the moment the client needs liquidity.
Limitations. All note prices are issuer indicative bids, so losses are a lower bound on forced-sale losses. The framework covers one payoff family. The four stress windows contain 51 weeks, about four in five stress observations come from 2022, and several near-barrier estimates rest on fewer than 20 notes. The sample is not a random draw from the US market, and one large US issuer is effectively absent. Above the barrier, the worst-of level is known only quarterly, so distance can be up to 100 days old. Notes that autocalled during an event are excluded. The issuer adjustment rests on one distressed issuer that was rescued. Finally, dynamic haircuts are procyclical by design: they rise as markets fall, which can amplify forced selling (CGFS, 2010; Gorton and Metrick, 2012). Lenders may want to phase increases in or set floors through the cycle.
Appendix A: Methodology
Selection. We selected 376 notes live through one or more stress windows, picking within each window by remaining term and underlying type, largest first and spread across issuers. 263 notes from 20 issuers had usable daily bids. For 221 notes, SPI lifecycle records give the payoff the note would deliver if redeemed on each day and the worst-of level at each observation date; 133 notes have both lifecycle observations and bids, giving 1,561 observation points. Above the barrier, the daily payoff is par and the worst-of level is known only quarterly; below it, the daily payoff equals the worst-of level. 219 of the 221 notes observe the barrier only at maturity.
Distance to barrier. Taken from the latest lifecycle observation within the previous 100 days when above the barrier, and from the daily lifecycle payoff when below it.
Sampling. Notes and benchmarks are both sampled Friday close to Friday close, because weekly data is what the benchmarks allow. Daily data is used only for descriptive measures (peak drawdowns, the Credit Suisse spread, volatility) and robustness checks.
Data checks. Notes quoted per $10 unit were converted to percent of par; about 740 placeholder bids and 120 one-day spikes were removed. Bids show no sign of smoothing (Geltner, 1993; Getmansky, Lo and Makarov, 2004): weekly autocorrelation is slightly negative (median -0.08 for index notes), and adjusting the notes that show positive autocorrelation moves stress losses by at most 2.3 points. Below the barrier, bids move with the lifecycle payoff on the same day for nine of ten issuers; one issuer’s bids move a day later, which points to a date-stamping convention rather than slow marking.
Issuer coverage. 113 selected notes from 24 issuers had no usable bids, 77 of them from three large US issuers; one of those is represented by only 3 of its 32 selected notes. The missing notes look like the included ones: the same split between index and single-share notes (56% and 44%), the same median barrier (60%) and a similar term profile. Dropping each issuer in turn moves the headline stress losses only within 10.3% to 10.9% for index notes and 36.0% to 38.1% for single-share notes. No issuer-level conclusion should be drawn for the least-represented issuer.
Precision. 78% to 81% of stress observations come from the 2022 drawdown. Dropping any single window moves the headline loss for index notes between 10.3% and 10.7%, and for single-share notes between 37% and 51%. Losses on the same note in consecutive weeks are not independent, so uncertainty is estimated with a cluster bootstrap that resamples whole notes. The 90% intervals for the headline figures are 10.0% to 11.1% for index notes and 34.3% to 41.5% for single-share notes.
Source: SP Intelligence, part of WSD.
Appendix B: Worst two-week loss by stress event
Source: SP Intelligence, part of WSD. Benchmarks: ChartRow.
Appendix C: Annualised bid volatility by remaining term
Source: SP Intelligence, part of WSD. Daily percentage change in each note’s bid, annualised by the square root of 252; notes with at least 40 daily returns in the bucket.
References
Basel Committee on Banking Supervision. Basel Framework, CRE22: Standardised approach: credit risk mitigation (version effective 1 January 2023 and later). Bank for International Settlements. Paragraphs 22.7, 22.49, 22.57 and 22.58.Getmansky, M., Lo, A. W. and Makarov, I. (2004). An econometric model of serial correlation and illiquidity in hedge fund returns. Journal of Financial Economics, 74(3), 529-609.
Gorton, G. and Metrick, A. (2012). Securitized banking and the run on repo. Journal of Financial Economics, 104(3), 425-451.