
Risk, Returns, and Investor Outcomes in the Swedish Structured Products Market
An empirical analysis of product design, costs, and realised performance
Authors: Tiago Fernandes and Soufiane Ahizoune
Published by: SPintelligence, part of WSD
March 2026
This report is for informational purposes only and does not constitute investment advice. Past performance is not indicative of future results.
1. Market Overview & Product Landscape
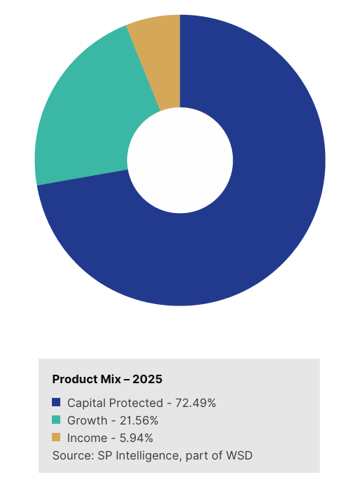
In 2025, the Swedish structured products market exceeded an estimated USD 1Bn in annual issuance, supported by sustained investor demand for growth-oriented payoff structures. This segment has been the primary driver of market activity, reflecting investors’ preference for participation in equity upside while maintaining clearly defined payoff profiles. Growth products have also contributed significantly to recent performance trends, benefiting from favourable equity market conditions over the past several years and consequently accounting for the majority of issuance last year.
Although modest in absolute terms compared with larger European structured product markets such as Germany, France, and Italy, the Swedish market exhibits a distinct investor profile characterised by strong equity participation and comparatively limited demand for capital preservation. This positioning is consistent with broader Swedish savings behaviour, which is notably oriented toward capital markets. Swedish households allocate only just over 10% of their financial assets to cash or bank deposits, significantly below the ~42% EU average, highlighting a structural preference for market-based investments and equity-linked instruments.
Structured products therefore serve as an intermediate instrument between direct equity ownership and traditional funds, allowing investors to maintain equity exposure while tailoring risk-return characteristics through structured payoff mechanisms.
2. Product Design & Expected Return Profile
The predominance of Growth products (72.49%) indicates a market strongly oriented toward equity participation strategies, typically offering leveraged or conditional exposure to underlying indices or baskets of equities. These structures are often used by investors seeking enhanced returns relative to traditional equity investments while benefiting from predefined payoff conditions. Growth/Participation structures are particularly attractive in markets with strong retail equity engagement, as they provide a familiar directional exposure while introducing conditional protection or leverage features.
Positioning Within Swedish Investor Portfolios
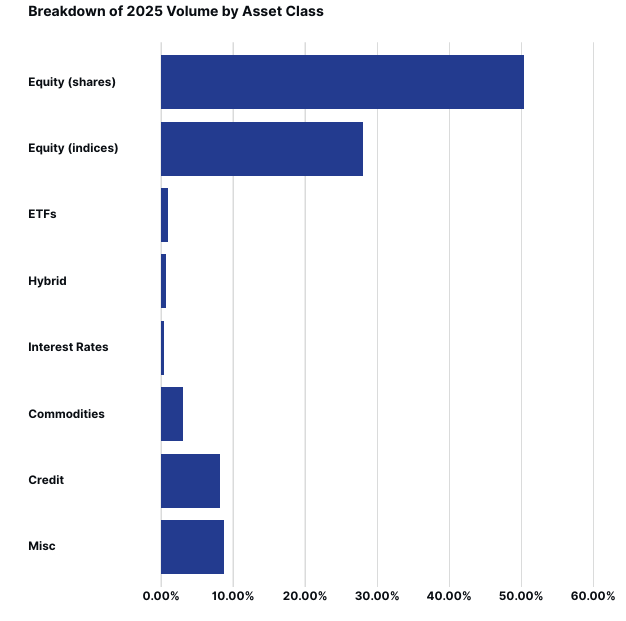
The structure of the Swedish structured products market closely reflects the broader investment behaviour of Swedish retail and private banking investors, who traditionally maintain a strong preference for equity exposure within their portfolios. This orientation is clearly visible in the underlying asset allocation of structured products issued in 2025. Equity-linked underlyings account for the overwhelming majority of issuance, with equity shares exposures representing 50.3% of products and equity indices accounting for a further 27.9%. Together, equity-based structures therefore represent nearly 80% of the market, underscoring the central role that structured products play as an alternative channel for accessing equity risk. By comparison, other asset classes remain significantly less represented, with credit-linked structures accounting for 8.16%, commodities for 3.04%, and only marginal allocations to interest rates (0.37%) and hybrid structures (0.67%). This distribution suggests that Swedish investors predominantly utilize structured products as vehicles for expressing equity market views rather than as diversified multi-asset instruments, reinforcing the broader equity-centric profile of household investment portfolios in Sweden.
Implications for Structured Product Demand
The payoff composition of the Swedish structured products market further illustrates this strong alignment with equity participation strategies. In 2025, participation structures dominate the market with a share of 56.14%, indicating a clear investor preference for payoff profiles that provide direct or leveraged exposure to underlying equity performance. Barrier-based structures also represent a meaningful share of issuance, including barrier Phoenix products (8.40%), barrier digital structures (4.13%), and capped barrier participation notes (2.24%), which typically combine conditional downside protection with enhanced upside participation or yield features. Credit-linked notes account for 8.16% of issuance, reflecting the complementary role of credit exposure as a yield-generating strategy within investor portfolios. In contrast, fully capital-protected structures remain relatively limited in scale, as illustrated by the comparatively small share of protected participation products (6.65%) and capped protected participation structures (0.44%). Overall, the payoff mix indicates that Swedish investors tend to favour structures designed to enhance or conditionally monetize equity performance rather than products primarily focused on capital preservation. Structured products therefore function largely as tactical instruments within equity-oriented portfolios, enabling investors to access customised payoff profiles while maintaining significant exposure to underlying equity market dynamics.
3. Costs & Fee Analysis
Understanding the cost structure of structured products is an important element when assessing investor outcomes and overall Value for Money (VfM). Unlike traditional asset management products that charge recurring management fees, structured products typically embed their costs within the product pricing at issuance. These costs reflect several components, including distribution fees, structuring costs, hedging expenses, and the issuer’s margin.
Average Annual Cost of Structured Products in Sweden
Based on the dataset of products distributed in the Swedish market, the average annualised cost per structured product has remained relatively stable over recent years, with a noticeable decline from 2022 levels.
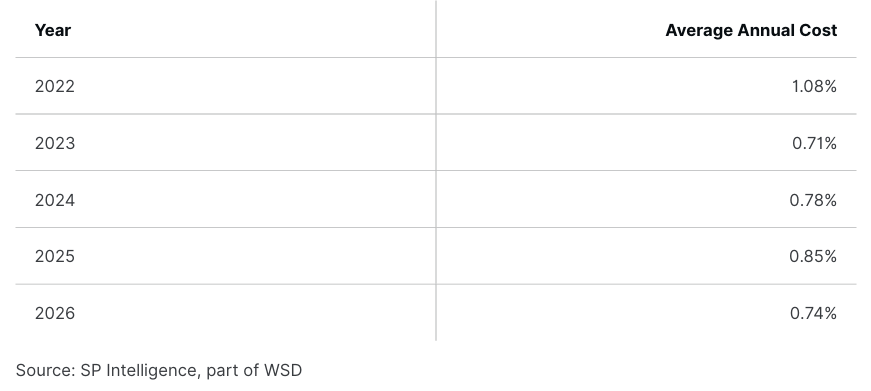
The data shows that average annual costs have generally ranged between 0.7% and 0.9% per annum, with a peak of 1.08% in 2022 followed by a reduction and stabilisation in subsequent years. The most recent observation for 2026 stands at 0.74%, indicating that costs have remained below 1% on an annualised basis for several consecutive years.
A meaningful share of these embedded costs typically reflects distribution fees paid to financial intermediaries, which compensate for product placement, client advisory services, and post-sale administration.
This level of pricing reflects several structural factors. First, increased competition among issuers and distributors has contributed to tighter margins. Second, the development of more efficient hedging and structuring techniques has reduced the cost of delivering certain payoff profiles. Finally, greater regulatory transparency around costs has likely contributed to downward pressure on pricing.
Comparison with Other Asset Classes
When comparing the cost structure of structured products with other investment vehicles, it is important to consider the different fee models used across asset classes.
Traditional actively managed mutual funds often charge annual management fees ranging from approximately 1.0% to 2.0% per year, depending on the asset class and distribution channel. In contrast, passively managed index funds and ETFs generally offer lower fees, often between 0.05% and 0.50% annually, reflecting their rules-based investment strategies and lower operational complexity.
Structured products occupy a middle position within this cost spectrum. With an average annualised cost of roughly 0.7–0.9%, they are typically less expensive than actively managed funds, while being more costly than passive index-tracking vehicles.
However, direct cost comparisons should be interpreted cautiously. Structured products incorporate features—such as capital protection, barrier mechanisms, and defined payoff structures—that replicate combinations of bonds and derivatives. The pricing of these embedded components reflects the cost of options and hedging strategies that would otherwise need to be implemented separately within a traditional portfolio.
4. Exposure & Underlying Asset Analysis
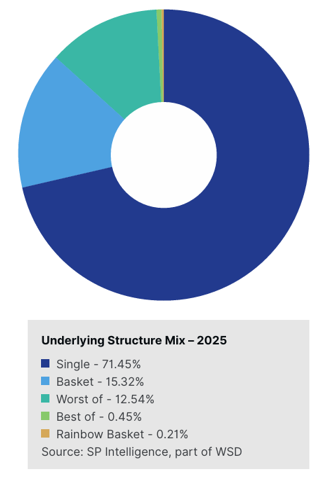
The exposure structure of Swedish structured products in 2025 shows a strong concentration in single-name underlyings, which account for 71.45% of issuance. This dominance highlights the importance of individual equities in the Swedish structured products market and reflects the strong familiarity of domestic investors with listed companies. It also corroborates the role of structured products as a vehicle for obtaining controlled exposure to equity markets, allowing investors to participate in the performance of individual stocks while benefiting from predefined payoff conditions that shape risk and return outcomes. Exposures based on baskets (15.32%) and worst-of structures (12.58%) represent a secondary share of the market, typically used to enhance coupon levels or participation rates through correlation effects across multiple assets.
Equity indices collectively represent a significant share of issuance, including exposures to regional benchmarks such as OMX Stockholm 30 Index, as well as major global indices including the S&P 500 Index, NASDAQ 100 Index, and the STOXX Europe 600 Index. A large share of issuance is also linked to individual Nordic and European equities, frequently grouped in sector or regional baskets that combine Swedish large-cap names with other European blue-chip companies. In parallel, credit-linked underlyings account for approximately 7.65% of products, while exposures to commodities, interest rates, or other alternative assets remain comparatively limited. Overall, the underlying asset mix reinforces the view that structured products in Sweden primarily function as equity-linked investment instruments, providing investors with structured access to both domestic and global equity market performance.
 5. Value for Money and Benchmarking
To assess whether structured products delivered appropriate outcomes for investors, a Value for Money (VfM) benchmark was calculated for each product at the time of issuance. The methodology follows the initial framework proposed by the UK Structured Products Association (UKSPA), which evaluates whether the expected return of a product is commensurate with the level of risk assumed by the investor.
Under this approach, the benchmark expected return is derived from the issuer’s funding cost and an appropriate market risk premium. Specifically, the benchmark combines:
• the Overnight Indexed Swap (OIS) curve at the issue date, representing the risk-free interest rate environment;
• the issuer’s Credit Default Swap (CDS) spread, reflecting the credit risk embedded in the product; and
• an equity risk premium adjustment, applied depending on the Summary Risk Indicator (SRI) classification of the product.
For lower-risk products (SRI levels 1–2), which typically consist of capital-protected structures with limited market exposure, the benchmark return is primarily derived from the sum of the OIS and CDS curves, reflecting the fixed-income characteristics of these structures.
For products with greater market exposure (SRI levels 3–6), an additional equity risk premium is incorporated to reflect the higher return expectations associated with equity-linked payoffs. For example, products classified as SRI level 6 are benchmarked against an expected long-term equity market return of approximately 8%, implying an equity risk premium typically ranging between 3% and 5% above the risk-free rate. For the highest risk category (SRI level 7), an even higher equity risk premium may be applied to reflect the increased volatility and downside risk embedded in these structures.
This methodology provides a risk-adjusted benchmark return against which realised product performance can be evaluated.
Realised Performance versus VfM Benchmark
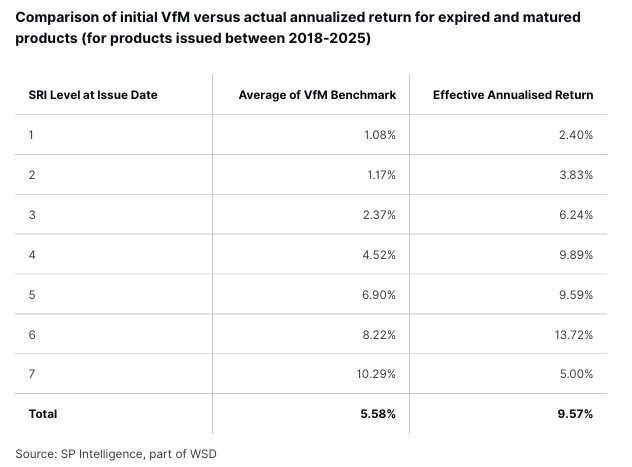
To evaluate the effectiveness of this framework, the initial VfM benchmarks were compared with the actual annualised returns realised by products that have expired or matured, focusing on products issued between 2018 and 2025.
The comparison indicates that, across most risk categories, realised returns exceeded the benchmark expectations derived at issuance. On average, the VfM benchmark implied an expected return of 5.58%, while the realised annualised return for expired products reached 9.57%.
The largest positive deviations were observed in higher-risk categories. For instance, SRI level 6 products delivered an average realised return of 13.72%, compared with a benchmark expectation of 8.22%. Similarly, SRI level 4 structures produced realised returns of 9.89%, more than double the benchmark of 4.52%. These results should be interpreted in the context of a favourable equity market environment over much of the observation period. In less supportive market conditions, realised outcomes may diverge more materially from the benchmark expectations.
Lower-risk categories also generally exceeded their benchmarks. SRI level 1 products delivered realised returns of 9.76%, significantly above the benchmark of 1.08%, although the sample size for these products may be limited and should therefore be interpreted with caution.
The only category where realised performance fell below the benchmark was SRI level 7, where products produced an average annualised return of 5.00% compared with a benchmark expectation of 10.29%. This reflects the higher volatility and asymmetric risk profile associated with the most complex or leveraged structures.
Overall, the analysis suggests that structured products issued in the Swedish market during this period delivered returns that were broadly consistent with, and in many cases exceeded, the expected risk-adjusted benchmarks, indicating that investors were generally compensated for the level of risk assumed.
6. Realised Performance Analysis
A key distinction within the structured products market lies between capital-protected and capital-at-risk structures, reflecting fundamentally different trade-offs between downside protection and return potential.
Capital-protected products are designed to preserve the investor’s principal at maturity, typically through bond components that guarantee capital repayment. While this protection significantly reduces downside risk, it also constrains the level of participation in the performance of the underlying asset. In contrast, capital-at-risk structures expose investors to potential capital losses if predefined barrier conditions are breached. In exchange for this conditional downside exposure, these products typically offer higher coupons or greater participation rates.
The realised performance in the Swedish market over the analysed period indicates that investors were increasingly compensated for assuming this additional risk. Capital-at-risk products consistently outperformed capital-protected structures, and the magnitude of the performance differential widened significantly over time.
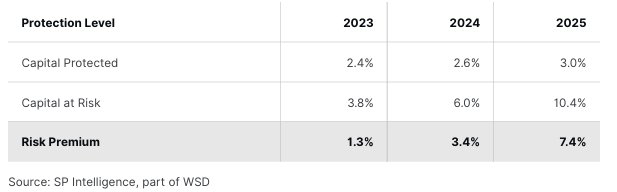
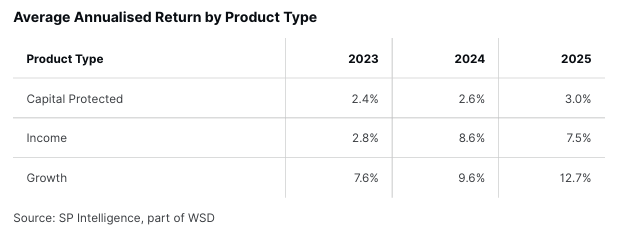
Capital-protected products delivered relatively stable returns of 2.4% in 2023, 2.6% in 2024, and 3.0% in 2025, reflecting their low-risk profile and limited upside participation. By contrast, capital-at-risk structures generated materially higher realised returns of 3.8%, 6.0%, and 10.4% over the same period.
As a result, the return premium associated with capital-at-risk products expanded markedly—from 1.3 percentage points in 2023, to 3.4 percentage points in 2024, and 7.4 percentage points in 2025. This widening gap suggests that market conditions during the period increasingly favoured payoff structures that allowed investors to capture stronger equity market performance or monetise volatility premia. In this environment, investors willing to accept conditional downside risk were rewarded with substantially higher realised returns.
Product Type Performance - Growth Structures Outperformed Income Products
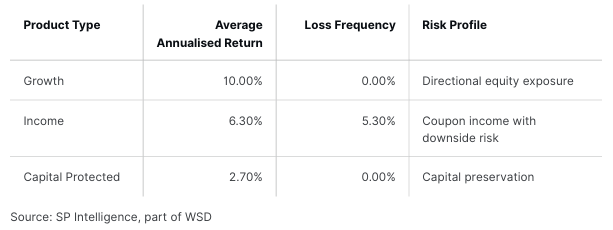
Participation-based growth structures generated the strongest realised performance over the sample period, delivering an average annual return of 12.7%. In addition to producing the highest returns, these products exhibited limited downside risk within the observed dataset, as none of the structures recorded negative outcomes.
This combination of strong returns and absence of realised losses reflects the favourable equity market environment during the period analysed. Growth structures benefit directly from upward market movements due to their participation-based payoff profiles, allowing investors to capture directional equity exposure while avoiding the short volatility characteristics often embedded in income strategies.
Income-oriented structures, by comparison, generated lower average returns of 7.5% while exhibiting materially higher downside risk. These products typically generate yield through conditional coupon payments linked to the performance of the underlying assets. However, their payoff structures often embed short volatility exposure and contingent equity risk. Consequently, realised outcomes were more dispersed, with the worst observed outcome reaching −56%, driven by barrier breaches in reverse convertible structures. This highlights the asymmetric risk profile inherent in many income products: relatively stable coupon income under normal market conditions but potentially large losses when underlying assets decline significantly.
Capital-protected products produced the most stable return profile, with realised returns clustered between 2–3% annually and no observed capital losses over the sample period. The principal protection feature effectively eliminates downside risk at maturity, making these products attractive for investors prioritising capital preservation. However, the cost of this protection is a constrained upside profile, as participation in the performance of the underlying asset is typically limited. As a result, capital-protected products generated the lowest realised returns relative to both growth-oriented and income-focused strategies.
Risk–Return Characteristics of the Swedish Market (2023–2025)
The realised outcomes across product categories highlight clear differences in risk-return profiles within the Swedish structured products market.
Growth structures delivered the highest average returns while exhibiting no realised losses within the observed sample, reflecting their direct exposure to favourable equity market conditions. Income structures generated moderate returns but showed a measurable loss frequency due to their conditional downside exposure. Capital-protected products maintained the lowest risk profile, providing stable but comparatively modest returns.
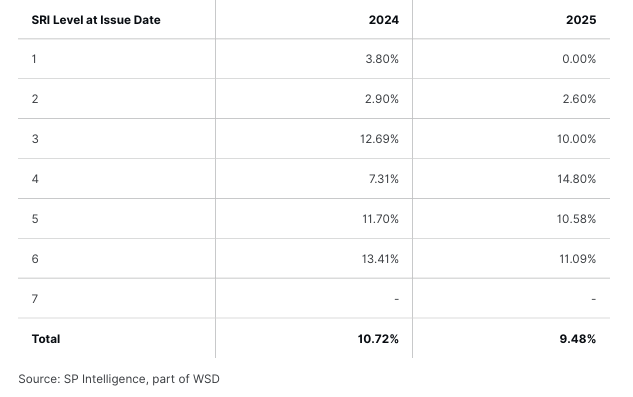
Performance by SRI Level
Analysing realised performance by Summary Risk Indicator (SRI) level provides additional insight into the relationship between risk classification and realised returns.
Higher SRI categories generally correspond to products with greater market exposure and therefore higher potential return volatility. The observed outcomes broadly reflect this relationship, with higher-risk categories tending to generate stronger average returns, although the pattern is not strictly monotonic due to differences in payoff structures and underlying exposures.
7. Investor Outcome & Suitability
Assessing investor outcomes is a central element in evaluating the effectiveness of the structured products market. In recent years, supervisory authorities—including the Swedish Financial Supervisory Authority—have raised questions regarding whether certain structured products provide appropriate value for investors and whether they are consistently distributed to suitable client segments. This section evaluates these concerns by examining realised product outcomes and the suitability of different risk categories for various investor profiles.
Realised Investor Outcomes
An analysis of expired and matured products issued between 2018 and 2025 indicates that realised investor outcomes were generally positive across most product categories. On average, products delivered annualised returns of 9.57%, compared with a Value for Money benchmark of 5.58% derived at issuance using the methodology described in the previous section.
In most Summary Risk Indicator (SRI) categories, realised returns exceeded the benchmark expectations calculated at the issue date. This suggests that investors were broadly compensated for the risks assumed, particularly in products with greater exposure to equity market performance.
Higher-risk products delivered the strongest realised outcomes. For example, SRI level 6 products produced an average annualised return of 13.72%, compared with an initial benchmark expectation of 8.22%. Similarly, SRI level 4 and SRI level 5 structures generated realised returns of 9.89% and 9.59%, respectively, both exceeding their benchmark levels.
These results reflect the favourable equity market environment over much of the analysed period, which supported strong performance in participation-based and growth-oriented payoff structures. Importantly, the analysis demonstrates that the risk-return relationship implied by the SRI classification broadly materialised in practice, with higher-risk categories delivering higher realised returns on average.
Risk Classification and Investor Suitability
The Summary Risk Indicator (SRI) framework is designed to provide investors with a simplified representation of the potential risk and reward characteristics of a financial product. However, the suitability of a given SRI category depends not only on the level of risk but also on the investor’s investment horizon, liquidity needs, and financial objectives.
Lower-risk categories (SRI levels 1–2) typically include capital-protected products or structures with limited market exposure. These products prioritise capital preservation and therefore may be appropriate for investors with a shorter investment horizon or a lower tolerance for market risk. However, their expected return profile is also correspondingly limited.
Products in the intermediate risk categories (SRI levels 4–5) represent a different risk-return balance. These structures generally provide moderate equity exposure or conditional income features, allowing investors to participate in market performance while maintaining defined downside risk parameters, such as protective barriers or partial capital buffers.
For investors with longer investment horizons and limited short-term liquidity requirements, these intermediate categories can offer a balanced risk-return profile. In particular, investors who do not rely on immediate access to invested capital may benefit from the structured payoff features and defined investment horizon commonly embedded in these products.
Considerations for Retiree Investors
Structured products are sometimes perceived as unsuitable for retirees due to their market exposure or complexity. However, such assessments should consider the heterogeneity of retiree financial situations and investment objectives.
Many retirees maintain multi-year investment horizons, particularly when managing assets intended to support income over extended retirement periods. For such investors, allocating a portion of their portfolio to products with moderate market exposure (SRI levels 4–5) may provide diversification and improved return potential compared with purely capital-protected instruments or low-yield fixed income alternatives.
Where retirees do not require immediate liquidity and can hold investments to maturity, the defined payoff structure of many structured products may help manage downside risk while still allowing participation in equity market performance. Over the period analysed in this report, products within these risk categories delivered realised returns that significantly exceeded both their initial Value for Money benchmarks and the returns observed in lower-risk categories.
It is important to emphasise that suitability must always be assessed on an individual basis, taking into account the investor’s financial circumstances, investment horizon, risk tolerance, and liquidity needs. Structured products should therefore be considered as one component of a diversified portfolio, rather than a standalone investment solution.
Implications for Market Oversight
The realised performance data presented in this report suggests that the Swedish structured products market has generally delivered positive investor outcomes relative to risk-adjusted benchmarks. While supervisory scrutiny remains important to ensure transparent product design and appropriate distribution practices, the empirical evidence indicates that many structured products have provided investors with returns consistent with—or exceeding—the risks undertaken.
Continued monitoring of product outcomes, combined with clear disclosure of risk characteristics and expected returns, remains essential to ensure that structured products continue to serve the investment objectives of a broad range of investors within the Swedish market.
APPENDIX: METHODOLOGY
Data Coverage and Scope
The analysis presented in this report is based on a dataset comprising 1,099 structured products issued in the Swedish market over the period from 2018 to 2025, covering issuance activity from 16 distinct issuers active in the market.
This dataset reflects aggregated issuance activity across the covered period and includes all products meeting the structured product definition outlined in this report.
Key product characteristics, including:
• Issue date and maturity
• Underlying asset(s)
• Coupon structure and coupon observation features
• Capital protection features
• Callability and barrier mechanics
• Upside participation and downside payoff profiles
• Product format (single underlying, worst-of, basket)
• Definition of a Structured Product
SPi defines a structured product as any investment instrument that:
• Provides a return linked to the performance of one or more underlying assets, which may include equities, indices, funds, interest rates, currencies, commodities, or other reference assets; and
• Has pre-defined payoff terms, including explicit upside participation, downside exposure, and capital protection characteristics.
The dataset includes:
Structured products issued and distributed in Sweden under approved base prospectuses (e.g., EMTN programmes). Products documented via:
• Final Terms
• Key Information Documents (KIDs) under PRIIPs Regulation
Issuance and Volume Calculations
• Products are analysed based on their issue date.
• Issuance volumes are calculated using the notional amount issued, expressed in USD millions.
• Where relevant, volumes are aggregated:
o By calendar year of issuance
o By product type (capital protected, growth, income)
o By region and asset scope
o By underlying asset or underlying combination
• Percentages are shown as whole numbers or rounded to the nearest one decimal place, depending on context.
Underlying Classification
Underlyings are classified by asset class, geographic exposure, and index or single-stock reference. Single underlying refers to products linked to one reference asset.
For products with multiple underlyings:
• Worst-of refers to products whose payoff depends on the lowest-performing underlying within a predefined set.
• Basket refers to products linked to a weighted or averaged combination of underlyings.
Given the large number of unique underlying combinations, league tables and charts display only the most significant underlyings or combinations by issuance volume. All remaining underlyings are aggregated and reported as “Other.”
Performance Metrics
• The average lowest underlying level represents the average performance of the least-performing underlying (relative to its initial level) across all products referencing that underlying over their life to date.
• This metric is expressed as a percentage of the initial underlying level at issuance and is intended to provide a standardized indication of performance across products.
Market Share Analysis
• Market share figures are calculated as the proportion of total issuance volume attributable to a given category (e.g., region, asset scope, product type) within the relevant period.
Presentation and Ordering
• League tables and rankings are ordered from highest to lowest issuance volume.
• Charts and tables may not sum to exactly 100% due to rounding.
• All figures are presented in nominal terms and are not inflation-adjusted.
Limitations
• As the data is sourced from external public disclosures, SPi cannot guarantee the completeness, timeliness, or absolute accuracy of the dataset.
• The analysis reflects primary issuance activity only and does not capture secondary-market trading or investor-level holdings.
• Interpretations reflect observed issuance behaviour and should not be construed as investment advice.


