
Canadian Market-Linked Investment Volumes Reach CAD 38.01Bn YTD (+26.2% YoY) as Structured Notes Continue to Drive Growth
Key Highlights
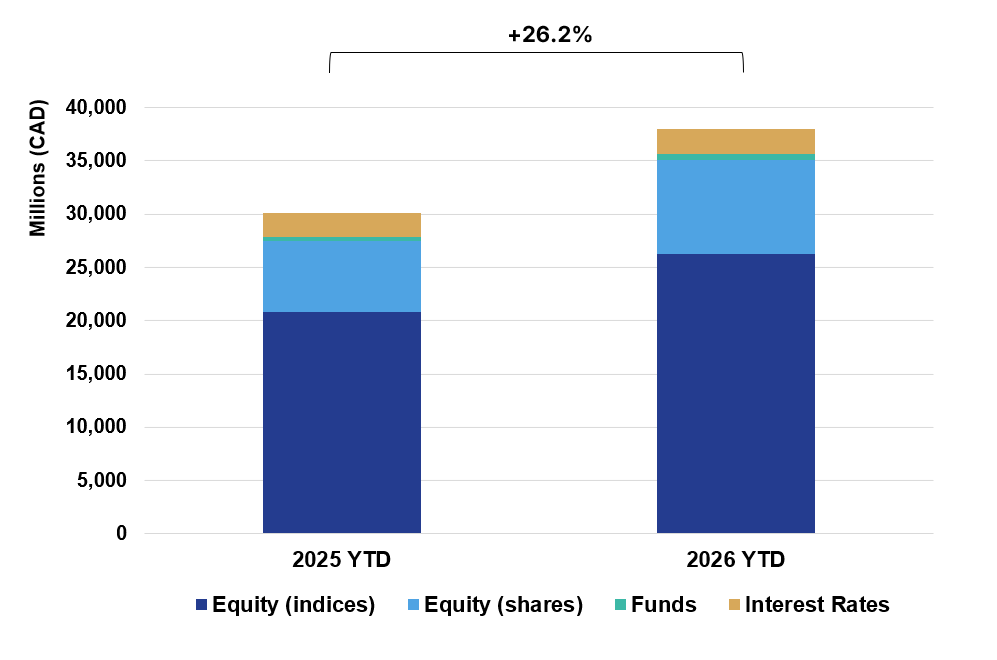
• Market Growth: Total Canadian market-linked investment volumes reached CAD 38.01Bn YTD in 2026, up 26.2% YoY from CAD 30.13Bn in 2025 YTD.
• Product Mix: Structured Notes reached CAD 28.89Bn YTD (+50.9% YoY), while GIC volumes declined to CAD 9.12Bn YTD (-17.2% YoY), highlighting continued divergence between note issuance and capital-protected deposits.
• Structure Mix: Principal at Risk (PAR) Notes dominate activity, accounting for 66.0% of total YTD market volumes and approximately 85.4% of Structured Notes YTD volumes.
• Payoff Structures: Income-oriented payoffs lead issuance, with Barrier Phoenix products at 41.8% and Barrier Digital Plus at 19.2%, together representing approximately 61.0% of total issuance.
Market Overview
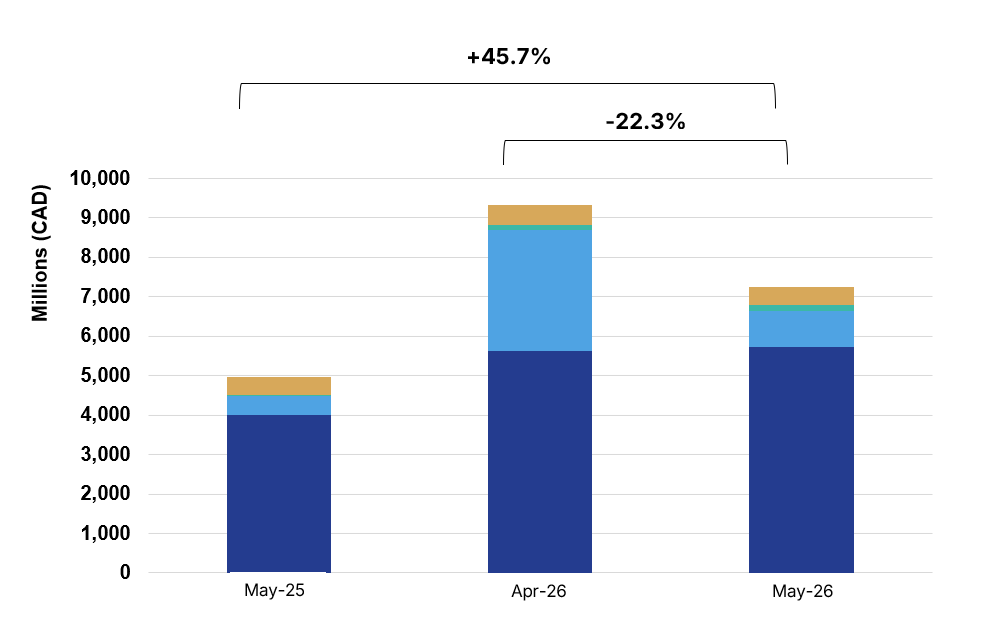
May 2026 confirms continued momentum in the Canadian market-linked investments market, with total YTD volumes reaching CAD 38.01Bn (+26.2% YoY). Growth was driven by Structured Notes, which reached CAD 28.89Bn YTD (+50.9% YoY), while GIC volumes declined to CAD 9.12Bn (-17.2% YoY), reflecting continued pressure on capital-protected deposit products.
Activity remains led by Principal at Risk (PAR) Notes, which accounted for 66.0% of total YTD volumes and approximately 85.4% of Structured Notes issuance. Income-oriented structures continue to dominate, led by Barrier Phoenix at 41.8% and Barrier Digital Plus at 19.2%, together representing approximately 61.0% of issuance.
Structurally, the market remains concentrated in single-underlying products at 82.2%, while basket structures account for 17.4% and Worst-of structures remain marginal at 0.4%. Equity-linked strategies continue to dominate asset allocation, with equity indices at 69.1% and single stocks at 23.1%. Overall, May reflects a Canadian market driven by accelerating Structured Notes issuance, PAR dominance, and sustained demand for income-oriented, equity-linked solutions.
Methodology & Notes
This report is based on SPi’s proprietary database of market-linked investments distributed in Canada. Figures reflect best-effort estimates based on available market data at the time of publication.
Disclaimers
Data Disclaimer (Best Effort / Completeness)
The information presented in this report is based on data collected from a variety of public and proprietary sources. While reasonable care has been taken to ensure accuracy, the data may be incomplete, subject to revisions, or may not capture the entirety of the market. SPi makes no representation or warranty, express or implied, as to the accuracy, completeness, or timeliness of the information.
General Disclaimer
This document is provided for informational purposes only and does not constitute investment advice, an offer, or a recommendation to buy or sell any financial instrument or to adopt any investment strategy. The views expressed are those of SPi at the date of publication and are subject to change without notice. Past performance is not indicative of future results.
SPi accepts no liability for any loss arising from the use of this report or its contents.


