U.S. Structured Products Issuance Reaches USD 92.9Bn YTD (+22.7% YoY) as Growth and Income Strategies Drive Momentum
Key Highlights
* Product Mix: Growth and Income together account for approximately 80% of issuance, while Capital Protected represents close to 20%, confirming a market oriented toward participation and yield.
* Structure Mix: Single-underlying structures lead at 58.9%, with Worst-of formats at 36.3%, reflecting continued demand for enhanced yield through autocallable-style exposures.
* Payoff Structures: Barrier Phoenix (31.9%) leads issuance, ahead of fixed income and rates-linked structures (13.4%), reinforcing the dominance of barrier-driven conditional coupon design.
* Underlying Trends: The SPX Index (12.4%) leads, alongside multi-index combinations incorporating NDX, RTY and INDU, with broader diversification across additional underlyings at 62.7%.
* Asset Allocation: Index-linked Equity (USD 46.5Bn) and Equity share-linked issuance (USD 25.7Bn) dominate, ahead of Interest Rate-linked activity at USD 13.8Bn.
Market Overview
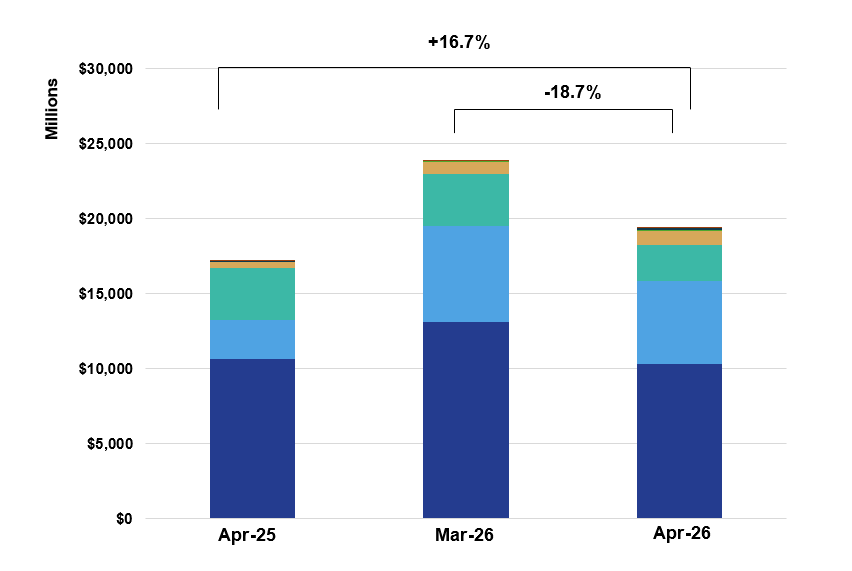
April 2026 confirms the sustained momentum of the U.S. structured products market, with year-to-date issuance reaching USD 92.9Bn (+22.7% YoY), supported by QTD volumes up 24.4% YoY and monthly issuance up 16.7% YoY. The product mix remains oriented toward market-linked exposure, with growth and income strategies together accounting for approximately 80% of flow and capital-protected solutions close to 20%, indicating a market prioritising participation and yield over principal security. Structurally, single-underlying formats retain the majority of issuance at 58.9%, while worst-of structures account for 36.3%, reflecting continued appetite for enhanced yield through correlation-sensitive, autocallable-style exposures. Payoff construction stays anchored in barrier-based architectures, led by Barrier Phoenix at 31.9%, with fixed income and rates-linked structures at 13.4% and participation and digital variants continuing to contribute meaningful share. On the asset side the market remains decisively equity-centric: index-linked equity issuance of approximately USD 46.5Bn and equity share-linked issuance of USD 25.7Bn sit well ahead of interest rate-linked activity at USD 13.8Bn, while QIS, FX, crypto, credit, commodities and ETF-linked structures remain smaller but continue to broaden the offering. Exposure is led by the SPX Index (12.4%), alongside multi-index combinations incorporating NDX, RTY and INDU, with broader diversification across additional underlyings representing 62.7%. Overall, April reflects a broad-based, growth-led market, combining strong issuance growth, participation-oriented allocation, and the continued dominance of equity-linked, barrier-driven structures.
Methodology & Notes
This report is based on SPi's proprietary database of structured products distributed in the United States. Figures reflect best-effort estimates based on available market data at the time of publication.
Disclaimers
Data Disclaimer (Best Effort / Completeness)
The information presented in this report is based on data collected from a variety of public and proprietary sources. While reasonable care has been taken to ensure accuracy, the data may be incomplete, subject to revisions, or may not capture the entirety of the market. SPi makes no representation or warranty, express or implied, as to the accuracy, completeness, or timeliness of the information.
General Disclaimer
This document is provided for informational purposes only and does not constitute investment advice, an offer, or a recommendation to buy or sell any financial instrument or to adopt any investment strategy. The views expressed are those of SPi at the date of publication and are subject to change without notice. Past performance is not indicative of future results.
SPi accepts no liability for any loss arising from the use of this report or its contents.