Every quarter, someone asks me whether structured notes are "getting bigger." Usually, I point to issuance volumes or outstanding AUM. This week I wanted to ask a different question: bigger relative to what?
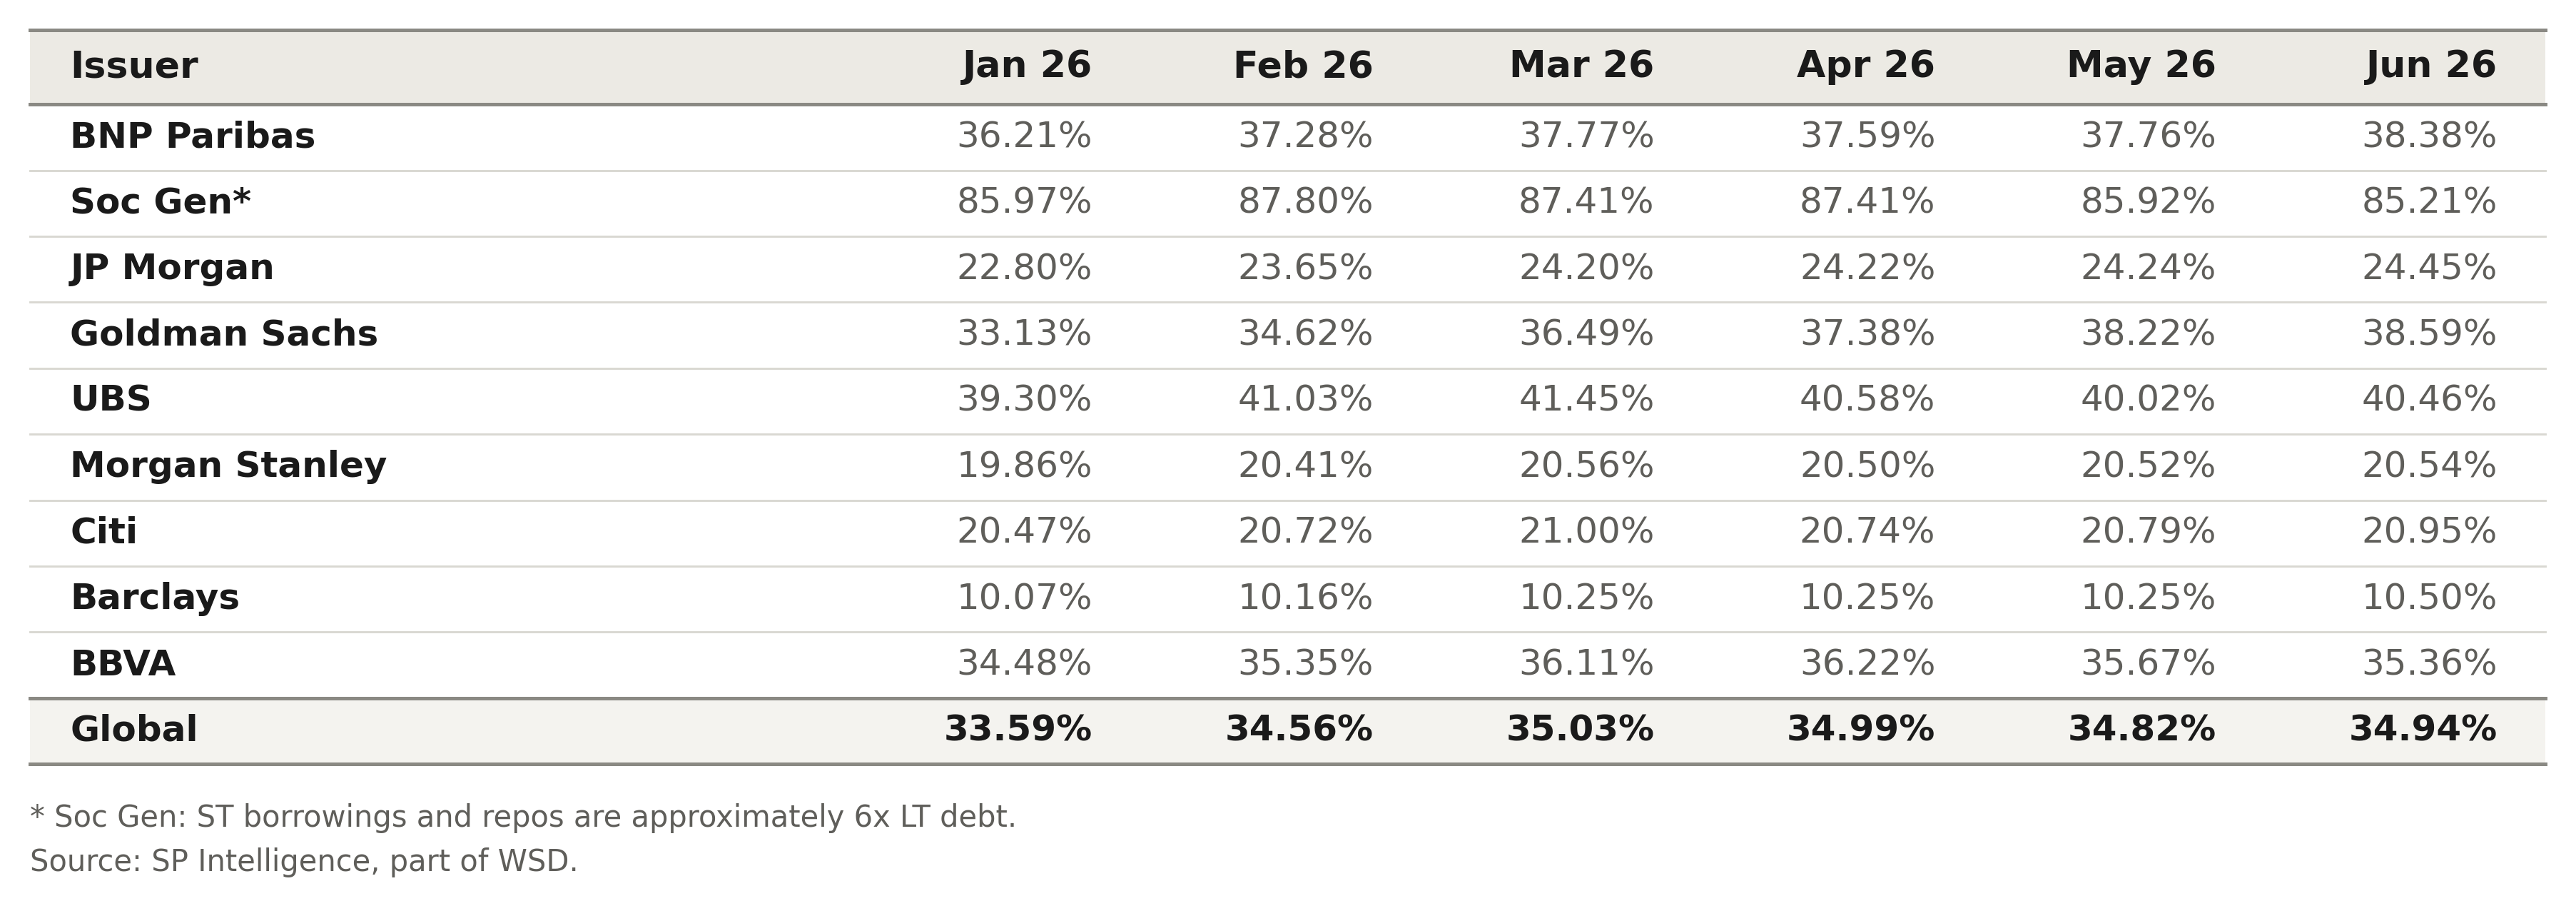
So, I lined up AUM of structured products per issuer against each bank's long-term debt, month by month, January through June 2026. The answer is more interesting than a single growth number.
The global picture: steady, not dramatic
Across the group (excluding China mainland), structured notes went from 33.59% of long-term debt in January to 34.94% in June, a +1.35 percentage point drift over six months. Not a spike. Not a headline. Just a quiet, consistent lean toward this funding channel, month after month, with no single month reversing the trend.
That steadiness is itself the story. This isn't a Q2 event. It's a slope.
But the average hides real divergence.
Break it down by issuer and the picture gets more interesting:
Goldman Sachs is moving fastest. From 33.13% in January to 38.59% in June, a 5.5 point jump in six months, the largest of any issuer in the set. Whatever is driving Goldman's structuring desk this year, it's showing up in the funding mix in a way that outpaces every peer.
Soc Gen lives in a different world entirely. At 85-88% of long-term debt, structured notes aren't a funding channel for Soc Gen — they're close to *the* funding channel, at least on the long-term side. Worth noting the caveat in the data: short-term borrowings and repos run roughly 6x long-term debt for Soc Gen, so this ratio needs to be read in that context, not compared directly to peers on a like-for-like basis.
Barclays and Morgan Stanley show up lowest in this dataset. Barclays sits at ~10%, Morgan Stanley at ~20%, both moved up only slightly over the half (+0.43pp and +0.68pp respectively). Based on what's captured here, structured notes look like a modest slice of the funding stack for these two rather than a core lever though see the data caveat below, particularly on Morgan Stanley.
Everyone else clusters in the middle, BNP Paribas, JP Morgan, UBS, Citi, and BBVA all sit somewhere between 20% and 40%, all trending gently upward, none dramatically.
What I take from this
Three things, none of them a hot take:
1. The reliance on structured notes as a funding tool is genuinely bifurcated across issuers. Some banks (Soc Gen) have built their model around it. Others (Barclays, Morgan Stanley) haven't and don't seem to be racing to change that. The "average" bank doesn't really exist here.
2. Goldman's trajectory is worth watching into Q3. A 5+ point move in one ratio, in one half-year, for one issuer, is the kind of thing that usually has a reason behind it, desk strategy, balance sheet management, or simply strong autocallable demand pulling more issuance onto the books. I don't have the "why" yet. I'm watching for it.
3. This is a funding conversation, not just a product conversation. Most of what gets written about structured notes focuses on investor outcomes, returns, buffers, decrement mechanics. This data is a reminder that on the other side of every note is a bank funding decision, and that decision is being made differently by every issuer on this list.
The open question
If structured notes keep drifting upward as a share of long-term debt across the board, slowly, but consistently at what point does this stop being a niche funding tool and start being treated as core to how banks fund themselves? Soc Gen may already be answering that question. The rest of the group looks like it's still deciding.
A data caveat
One honest limitation worth flagging: this dataset may not fully capture historical AUM, particularly issuance booked out of Asia. That gap likely affects several issuers to some degree, if a meaningful share of its structured note activity sits in Asia and isn't fully reflected here, its true ratio (and possibly its trajectory) could look different from what's shown below.
AUM of structured products per issuer vs. long-term debt (USD equivalent, published year-end 2025 statement), January–June 2026